The moon and earthquakes
A recurrent theme of this blog is that your taxes (or, even better, other people’s taxes) pay for the collection of a lot of high-quality data on an amazing range of topics, and you can just go and look it up.
For example, the US Geological Survey has a database of earthquakes that anyone can search. It includes pretty much everything since 1973, and a more limited coverage back into prehistory. John Walker’s web site Fourmilab has a range of interesting astronomical pages, including an earth-moon distance calculator.
Combining these, we can look at the distance from the earth to the moon for all 62667 earthquakes of magnitude 5.0 or greater from 1973 up to early this morning. Using a complete census this way it’s easy to avoid cherry-picking results that support whatever conclusion you want. For convenience I translated the earth-moon distance calculator into R, so I could run it more easily on large batches of data.
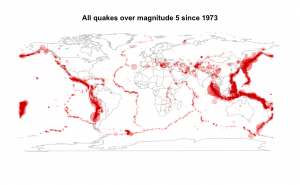 The map (click to embiggen) shows all the quakes, with the total amount of red ink for each quake proportional to the size (so magnitude 5 quakes are small and faint, and magnitude 9 are large and dark). You can see the plate boundaries clearly, and a few interesting anomalies such as nuclear testing sites in the US and the former USSR.
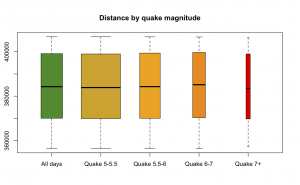
We can compare the distance to the moon at midnight each night with the distance at times of quakes of different sizes, to see if there is any visible pattern. Here’s a boxplot: there is no sign of any difference in the distances between ‘all days’ and quake times, or between quakes of different sizes.
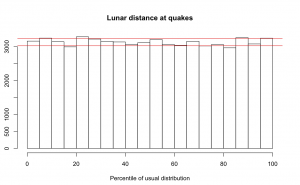
Another possible way to compare the distance is to divide up the orbit of the moon into twenty ‘bins’ with the same amount of time spent in each bin, and then count how many quakes are in each bin. In the histogram below, the red lines indicate the amount of sampling error, and the black lines show the observed counts. If there were more quakes when the moon was closer, the quake times would be piled up on the left of the plot. In fact, the quake times are spread evenly across the distance range.
None of these graphs is ideal, because we’re trying to compare whole distributions: the distribution of distances to the moon at midnight each night, and the distribution of distances to the moon at each quake. A more appropriate graphic is a quantile-quantile plot, which sorts both distributions from smallest to largest and plots equivalent distances along both distributions. When the two distributions are identical, the graph looks like a straight diagonal line; any deviation from equality shows up in the position or shape of the line.
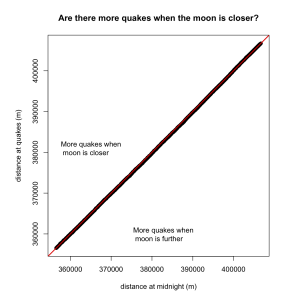 If there were more quakes when the moon was close, the points would tend to lie above the diagonal red line, and if this happened mostly at ‘supermoons’ when the more was very close, the points would be above the line only at the bottom left. This is precisely what we don’t see. It’s very rarely that you see a quantile-quantile plot that shows this level of agreement between distributions — there is no suggestion whatsoever in this data that the distance to the moon is associated with earthquakes.
One final visualization to leave you with. One of the maps below shows all the quakes that occurred when the moon was in the 5% closest part of its orbit. The other is all the quakes when the moon was in the 5% furthest part of its orbit. Can you work out which is which?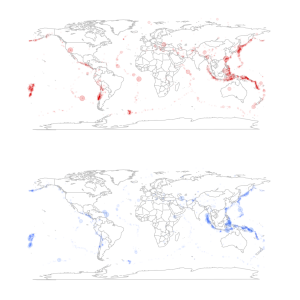
Thomas Lumley (@tslumley) is Professor of Biostatistics at the University of Auckland. His research interests include semiparametric models, survey sampling, statistical computing, foundations of statistics, and whatever methodological problems his medical collaborators come up with. He also blogs at Biased and Inefficient See all posts by Thomas Lumley »
What about the influence of gas fracking? Is there any data available to test the hypothesis of non-independence between the geographical position or the time of occurrence of earth quakes and drilling areas (or the two factors combined)?
13 years ago
It’s tricky because fracking happens in small areas that tend to be fairly geologically stable. There’s probably enough quake data, but I don’t know where to get the drilling area data.
13 years ago
So, it would be fracking hard to do?
13 years ago
How about the first derivative of the distance of the moon from the earth? Or maybe even the second. I would imagine that a changing gravitational force would be more stressful than a steady one. The daily tidal surges would be the strongest stressors surely. Maybe you could find a database that lets you plot where the moon was in the sky at the time of each earthquake.
13 years ago
I would also have guessed the first derivative if I were making this up rather than checking someone else’s hypothesis. Dependence on the first derivative would still show up in the plots: that would mean more quakes when the moon is close to its median distance from the earth. The second derivative would also show up that way: it is highest when the moon is closest or furthest. There’s no suggestion of either phenomenon.
An effect of phase of the moon wouldn’t necessarily show up in the plots, but wouldn’t be too hard to investigate — the code that computes distance also computes phase.
13 years ago
Actually, having thought about this more, the force changes most rapidly when the moon is closest, due to the rotation of the earth.
13 years ago
How about introducing seasonality in the model?
Another big earthquake in Chch, in February, in another very dry summer.
I think that the water weight acting on the ground creates stress that can cause an earthquake … and that the moon acts on the in-ground water just as it acts on the tides and atmosphere.
There is a problem with independence of events. Is this latest earthquake an aftershock to the 2011 event or unrelated? Were the Seddon, St Anaud, Ekatahuna earthquake swarms related to either events?
(I personally think yes and yes.)
It could be that the moon triggers an initial quake and then the many after shocks happen at random swamping the signal in the first event. And then it’s near impossible to identify the first event anyway.
8 years ago
It could be that there’s a version of the moon hypothesis that isn’t completely ruled out by the data, yes. I’d be a bit surprised if geologists hadn’t noticed, but the analysis could be done if the hypothesis were precisely specified.
8 years ago