In real terms
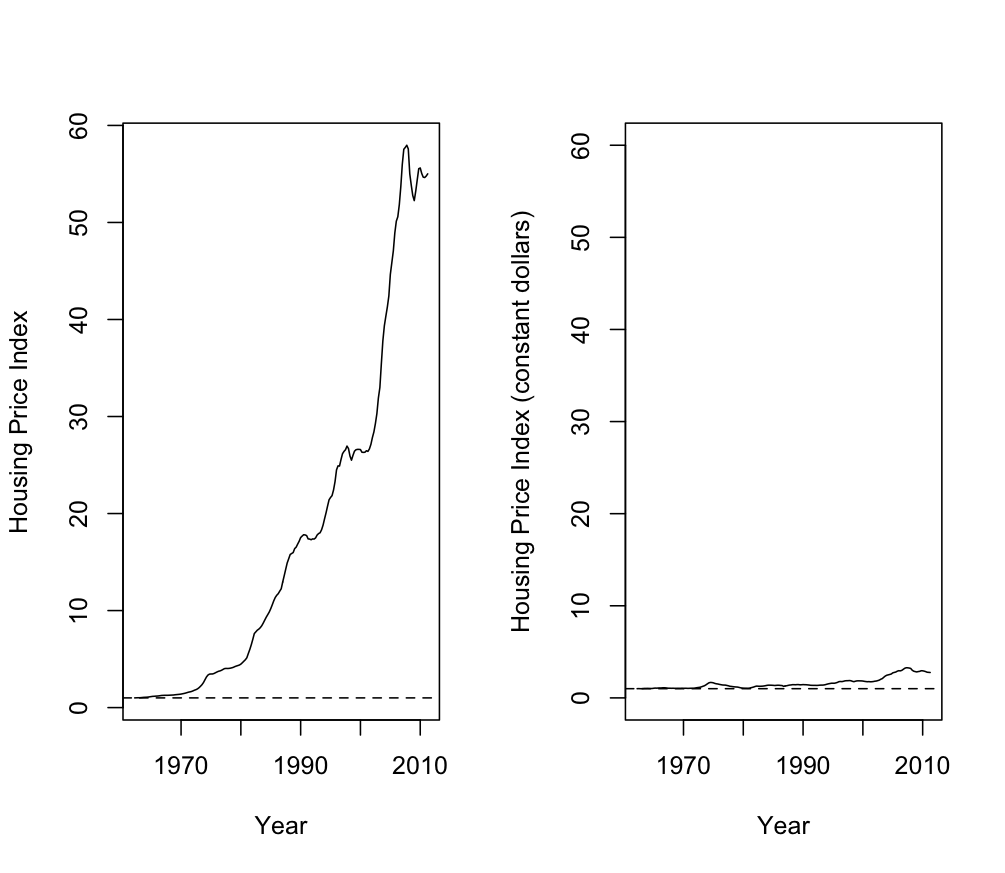
Housing prices are in the news again, and I was curious to see how much of the change in prices is just ordinary inflation, and how much is real improvement. Over the past 45 years, housing prices have increased more than fifty-fold. Barfoot & Thompson like to point this out, and they have a graph of Auckland prices that is designed to show the increase very dramatically. But other things from apples to yachts are also more expensive than they were in the past.
 The graphs on the left show the QV national house price index since the late 1960s, and the house price index divided by the consumer price index (CPI: ie, inflation). Nearly all the increase in prices has been due to the dollars getting smaller, not the houses getting more valuable.
You could reasonably object that housing prices are an important component of CPI, and that dividing by CPI will over-correct.
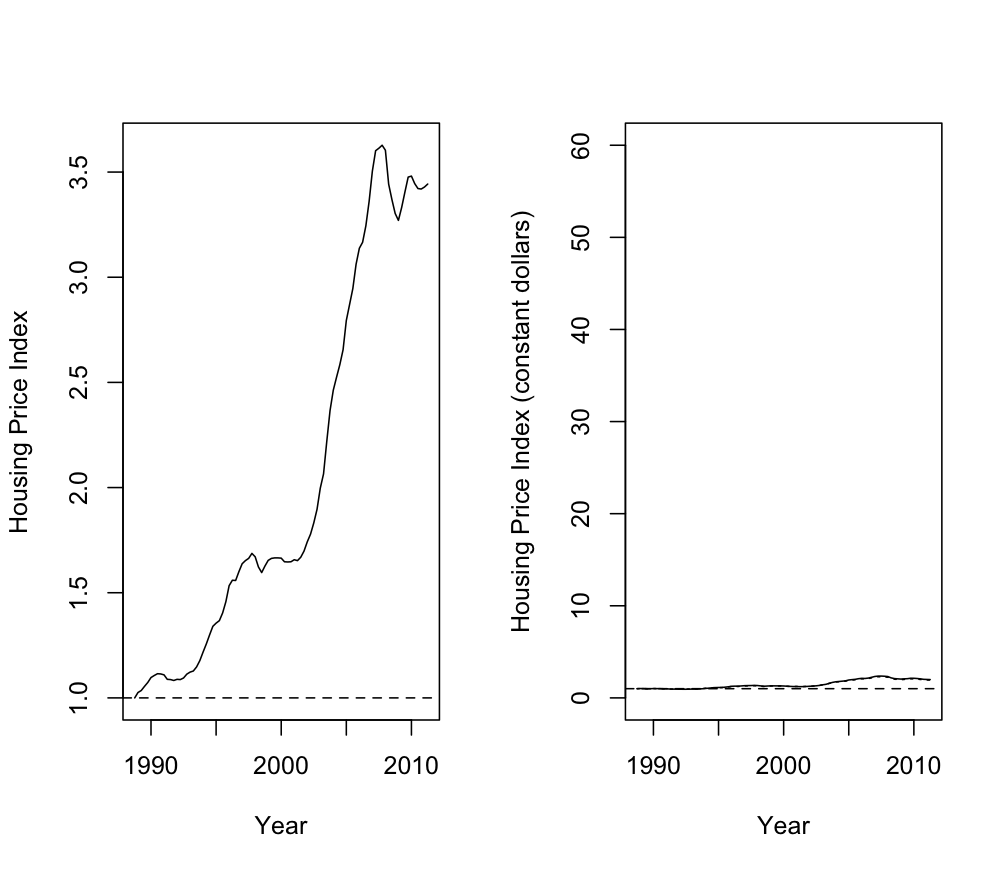
To handle this problem, I also tried dividing by the CPI without housing and non-tradable items. This was only available from 1988 in the files I looked at, so I re-did the graphs using data from 1988 on.

The second graph shows the data from 1988 on. The basic shape of the left-hand panel with the house price index is the same, but the increase is smaller given the shorter time scale.
On the right-hand panel you will not be able to see two lines (because they overlap almost perfectly). These two lines show the housing price index deflated by CPI and by CPI less housing and non-tradable components.
Thomas Lumley (@tslumley) is Professor of Biostatistics at the University of Auckland. His research interests include semiparametric models, survey sampling, statistical computing, foundations of statistics, and whatever methodological problems his medical collaborators come up with. He also blogs at Biased and Inefficient See all posts by Thomas Lumley »
After you further adjust the inflation-adjusted house price data for the increasing size of houses that bump in the chart may flatten out or even drop negative.
12 years ago
Yes, improvements in size and quality will make new houses more expensive and make the increase look bigger than it really is.
In the other direction, if there is increasing demand for some ‘old’ house feature like rimu floors or traditional villa style, it will make old houses more expensive and make the increase look smaller than it really is.
12 years ago
Actually the way house prices are used in the CPI is more complicated than simply using median house prices. For example consider you bought a house worth $100,000 20 years ago and sold it today for $200,000 to buy a very similar house in a different part of the city for $200,000. The effect of the inflation as an economist would see is not the 100% increase in 20 years. AS anyone will tell you buying your first house is the tough part. For full technical details of house prices in the CPI I refer yiou to http://www.stats.govt.nz/browse_for_stats/economic_indicators/cpi_inflation/home-ownership-in-the-cpi.aspx
12 years ago
Thanks for the extra details.
In my experience it’s selling your first house on the other side of the world in order to buy one here that’s the tough part,but that (I hope) is a temporary phenomenon.
12 years ago