October 11, 2012
Make your own data maps
Indiemapper is a web-based tool for creating maps for data visualisation, based on your data or their built-in files. Here’s an example, showing cumulative inflation 2001-2008
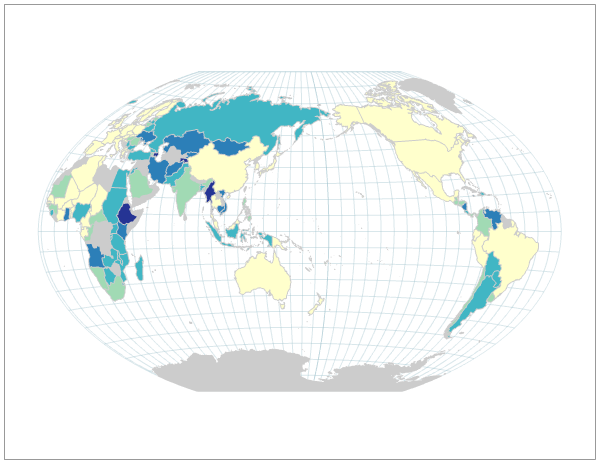
It knows about projections, sensible colour schemes, and ways of representing information on maps. It’s a bit slow, since it has to run in your browser, but it’s well worth trying
Thomas Lumley (@tslumley) is Professor of Biostatistics at the University of Auckland. His research interests include semiparametric models, survey sampling, statistical computing, foundations of statistics, and whatever methodological problems his medical collaborators come up with. He also blogs at Biased and Inefficient See all posts by Thomas Lumley »