Another dimension for graphics
We’ve encountered Karl Broman before, for his list of the top ten worst graphs in the scientific literature. He also has some nice examples of interactive scientific graphics, both stand-alone and embedded in slides for talks.
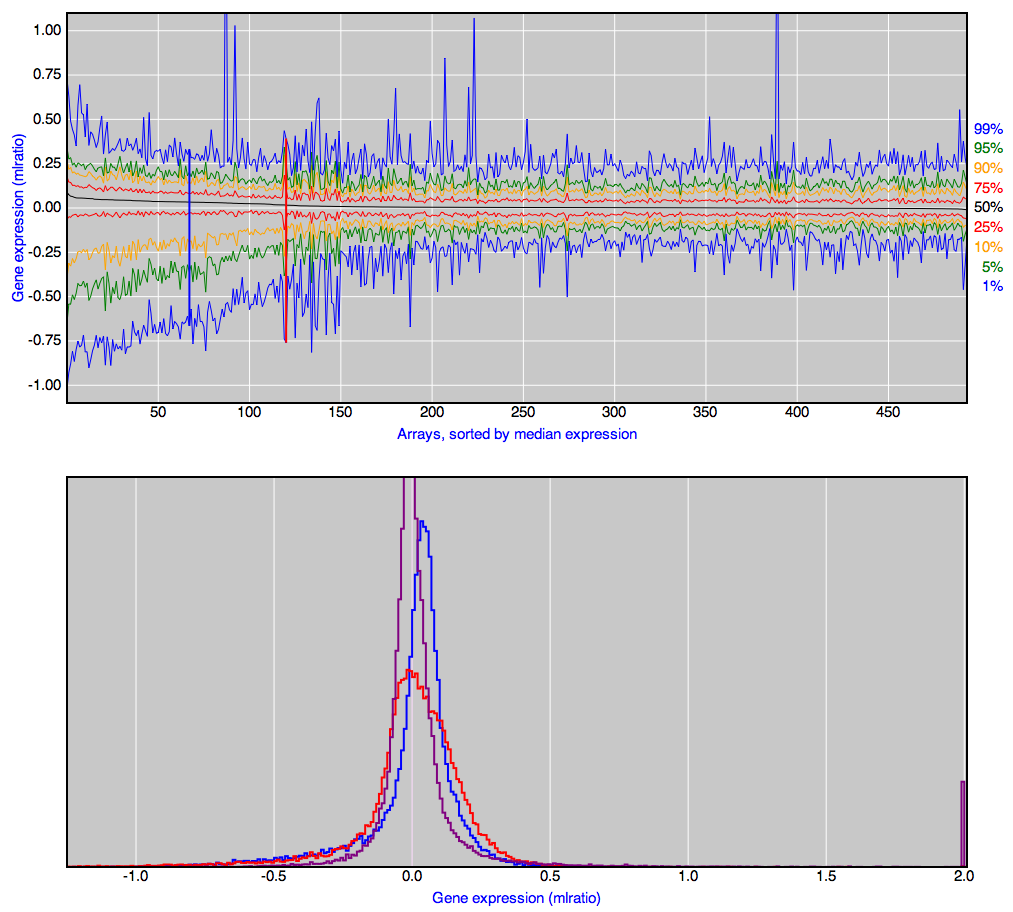
One example: 500 boxplots of gene expression ratios (no, you don’t need to know or care what these are). The top panel shows minimum, maximum, median, quartiles, and as you move the mouse along, the bottom panel shows the whole distribution. Click, and the distribution stays in the bottom panel for comparison with others.
Karl, on Twitter, has also recommended a column on visualisation in the journal Nature Methods, but it’s not open-access, sadly.
Thomas Lumley (@tslumley) is Professor of Biostatistics at the University of Auckland. His research interests include semiparametric models, survey sampling, statistical computing, foundations of statistics, and whatever methodological problems his medical collaborators come up with. He also blogs at Biased and Inefficient See all posts by Thomas Lumley »