Killing people
TV3 has tried to stir up the issue of the death penalty in New Zealand. They have a poll showing majority opposition by the country as a whole, and by supporters of every party except NZ First. Even the Sensible Sentencing Trust isn’t in favor.
The lead-in to the story is that the murder rate has never ‘recovered’ from the abolition of the death penalty. They have a graph showing homicides per capita rising and then falling again, but not to the earlier levels.
Using the term ‘recovered’ comes very close to asserting a causal connection; but is there even a reliable correlation? International comparisons are useful here. I don’t have long time series for homicide, but Kieran Healy has produced a graph of international trends in deaths due to assault. This isn’t the same as homicide, but is close enough to be relevant.
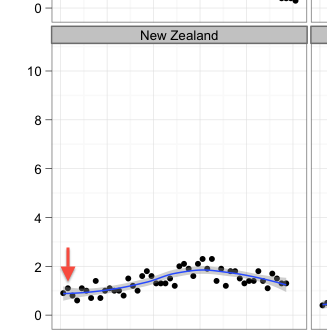
Here’s the New Zealand panel, with the arrow indicating the abolition of the death penalty. The details are slightly different from those for homicide, but the basic trend is the same that TV3 reports.
and here’s the international comparison, with NZ second from the bottom, on the left. As usual, click to embiggen
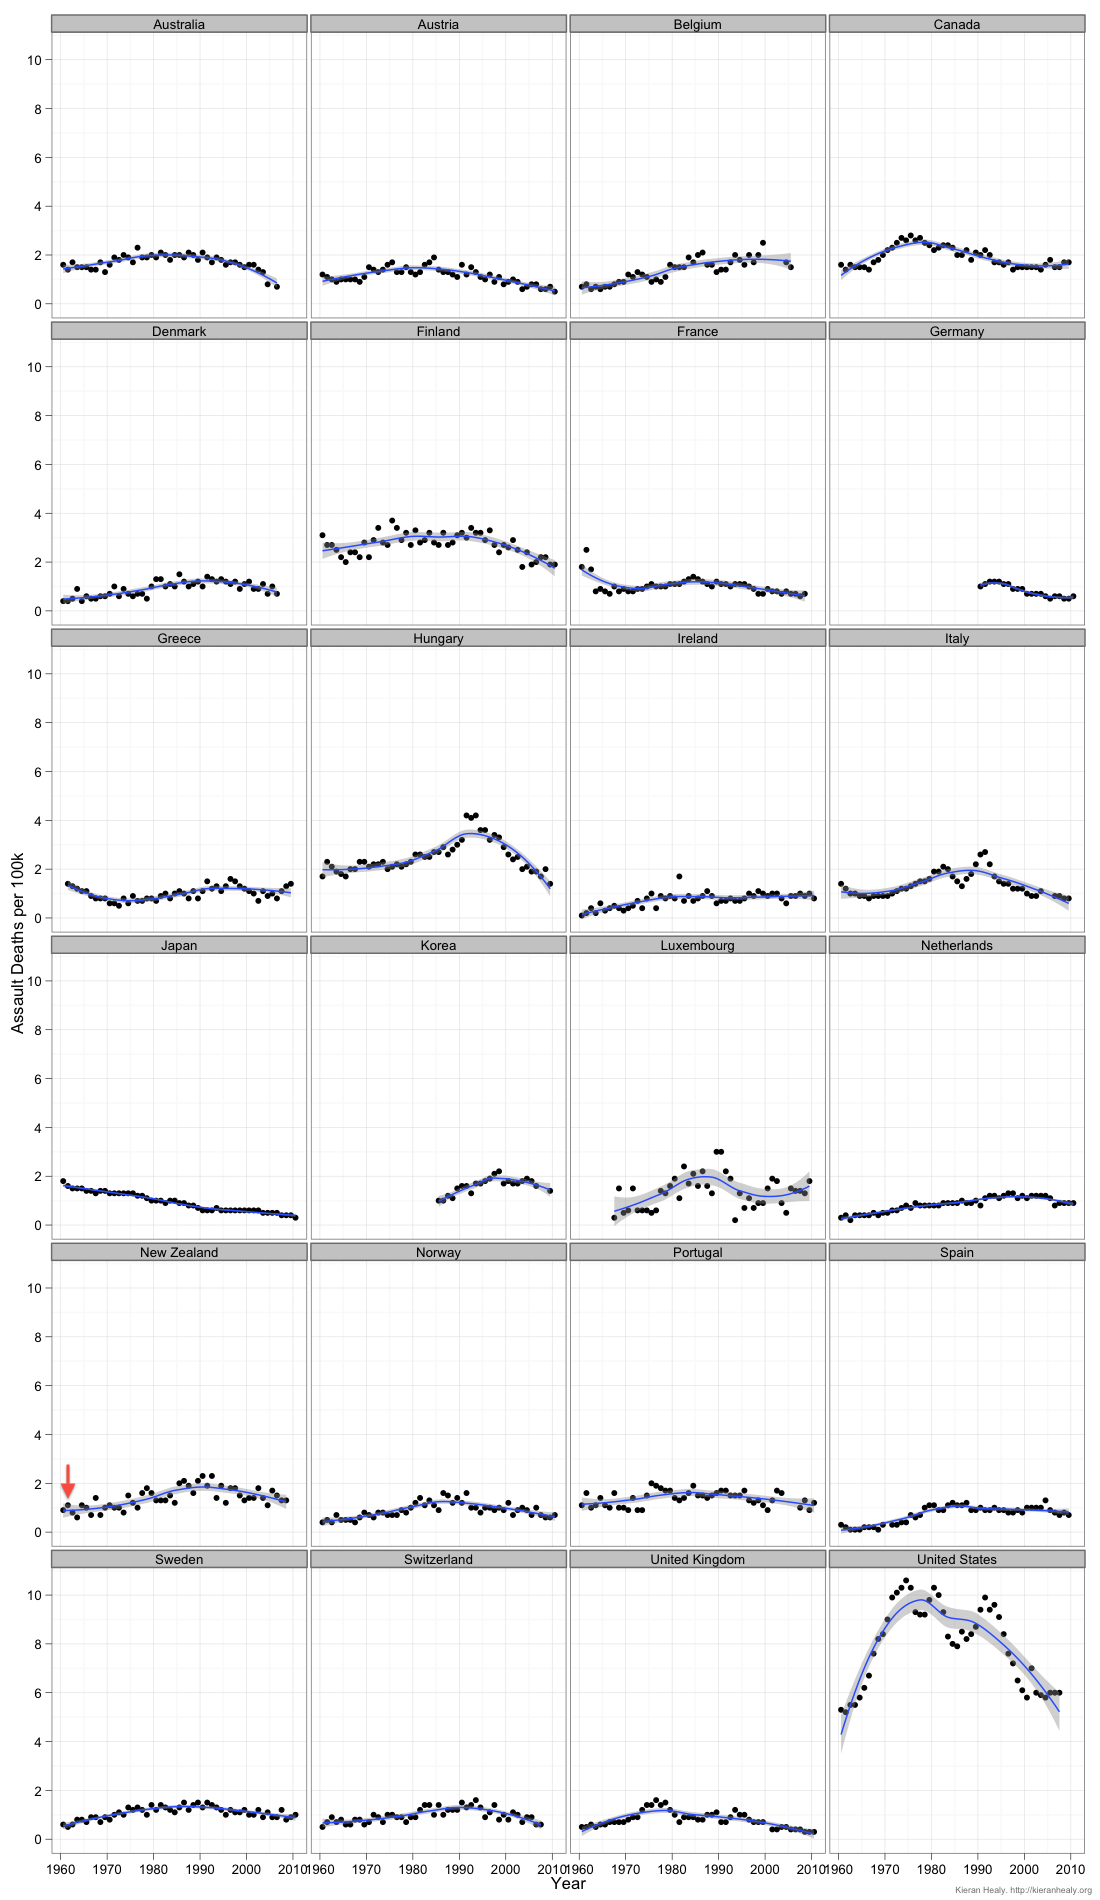
The NZ pattern is very similar to other countries, including Australia (where abolition didn’t happen until about 10 years later), Finland (where it was abolished in 1949 for crimes committed in peacetime), and Switzerland (1942).
If you look at the countries that still have the death penalty, murder rates are low and falling in Japan, South Korea had the same sort of rise and fall that NZ has had (over a shorter time scale), and of course there’s the USA.
It doesn’t look as though the death penalty is a major driving force in these patterns.
Thomas Lumley (@tslumley) is Professor of Biostatistics at the University of Auckland. His research interests include semiparametric models, survey sampling, statistical computing, foundations of statistics, and whatever methodological problems his medical collaborators come up with. He also blogs at Biased and Inefficient See all posts by Thomas Lumley »
Let’s see: 624 people and what’s the percentage of the vote the NZ First got at the last election? So how many people likely to make up that NZ First percentage? And the sampling error on that (leaving aside other sources of survey error)?
11 years ago
NZ First got 6.59% at the last election, so you’d expect 41 respondents. Observing 84% support gives a lower bound for the true proportion that’s well above 50%. Even with just 20 respondents that would still be the case.
We actually do know about margin of error here.
11 years ago