Auckland population density
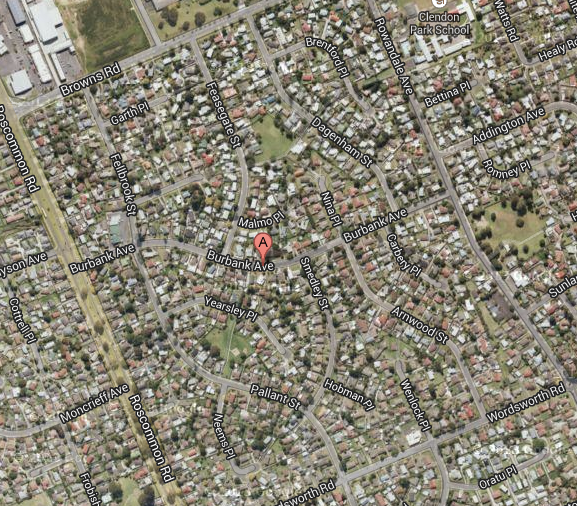
This is a satellite photo of the 5th most densely populated census area unit (out of 411) in the Auckland supercity, based on 2013 census data.
Here are the top thirty, some of which might be surprising
| name | location | people/sq km | |
|---|---|---|---|
| 1 | Auckland Central East | Auckland City | 10911 |
| 2 | Auckland Central West | Auckland City | 10032 |
| 3 | Grafton West | Auckland City | 6414 |
| 4 | Eden Terrace | Auckland City | 5550 |
| 5 | Burbank | Manukau City | 5180 |
| 6 | Favona South | Manukau City | 5174 |
| 7 | Harania East | Manukau City | 4758 |
| 8 | Onehunga North West | Auckland City | 4692 |
| 9 | Clendon South | Manukau City | 4689 |
| 10 | Sandringham West | Auckland City | 4642 |
| 11 | Ponsonby East | Auckland City | 4628 |
| 12 | Sandringham East | Auckland City | 4564 |
| 13 | Rowandale | Manukau City | 4538 |
| 14 | Clover Park | Manukau City | 4529 |
| 15 | Puhinui | Manukau City | 4464 |
| 16 | Oranga | Auckland City | 4462 |
| 17 | Hyperion | Manukau City | 4452 |
| 18 | Otahuhu North | Auckland City | 4450 |
| 19 | Harania West | Manukau City | 4393 |
| 20 | Mt Eden South | Auckland City | 4369 |
| 21 | Papatoetoe West | Manukau City | 4364 |
| 22 | Homai West | Manukau City | 4289 |
| 23 | McLaren Park | Waitakere City | 4224 |
| 24 | Viscount | Manukau City | 4222 |
| 25 | Aorere | Manukau City | 4176 |
| 26 | Grey Lynn West | Auckland City | 4152 |
| 27 | Grey Lynn East | Auckland City | 4140 |
| 28 | Onehunga North East | Auckland City | 4108 |
| 29 | Ferguson | Manukau City | 4101 |
| 30 | Papatoetoe North | Manukau City | 4049 |
[nerdy technical update: It’s possible the densities are off by a constant scale factor, since I’m not sure what projection the boundary data used, but they are not far off and are in the correct relation]
[update again: the areas and names are based on the 2006 Census ESRI shapefiles for Auckland, from here, the population data from here]
Thomas Lumley (@tslumley) is Professor of Biostatistics at the University of Auckland. His research interests include semiparametric models, survey sampling, statistical computing, foundations of statistics, and whatever methodological problems his medical collaborators come up with. He also blogs at Biased and Inefficient See all posts by Thomas Lumley »