January 7, 2014
NZ electoral visualisations
The first post at the new Hindsight blog is on Chris McDowall’s hexagonal maps of NZ political geography.
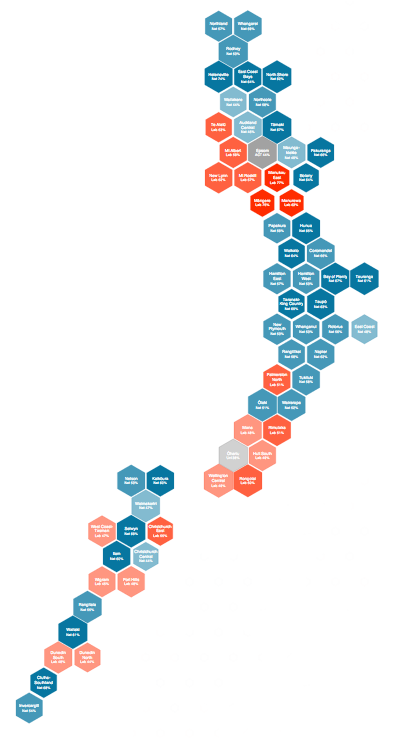
He also has some slides describing the construction of another visualisation, relating party vote to deprivation index.
Thomas Lumley (@tslumley) is Professor of Biostatistics at the University of Auckland. His research interests include semiparametric models, survey sampling, statistical computing, foundations of statistics, and whatever methodological problems his medical collaborators come up with. He also blogs at Biased and Inefficient See all posts by Thomas Lumley »