Evils of axis
The UK Statistics Authority, among its other responsibilities, has the job of writing polite but firm letters to government bodies that misuse statistics. Yesterday’s installment is about the UK National Infrastructure Plan, which contains a chart showing how planned and ongoing infrastructure projects (ie, the infrastructure pipeline) are in all sorts of useful areas.
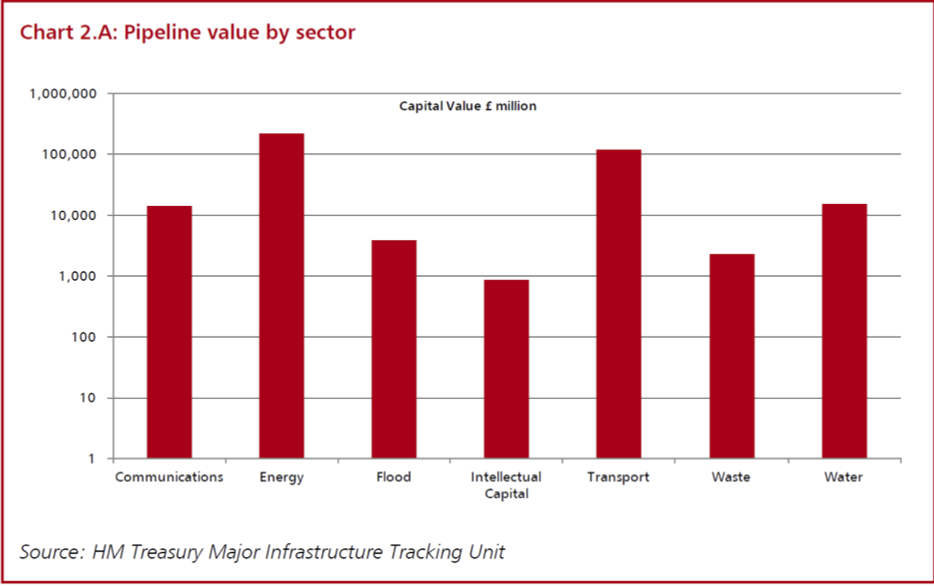
At least, that’s what it shows if you don’t look closely enough to see the y-axis is in powers of ten. The Statistics Authority thinks
the chart could leave readers with a false impression of the relative size of investment between sectors.
and suggests this revision
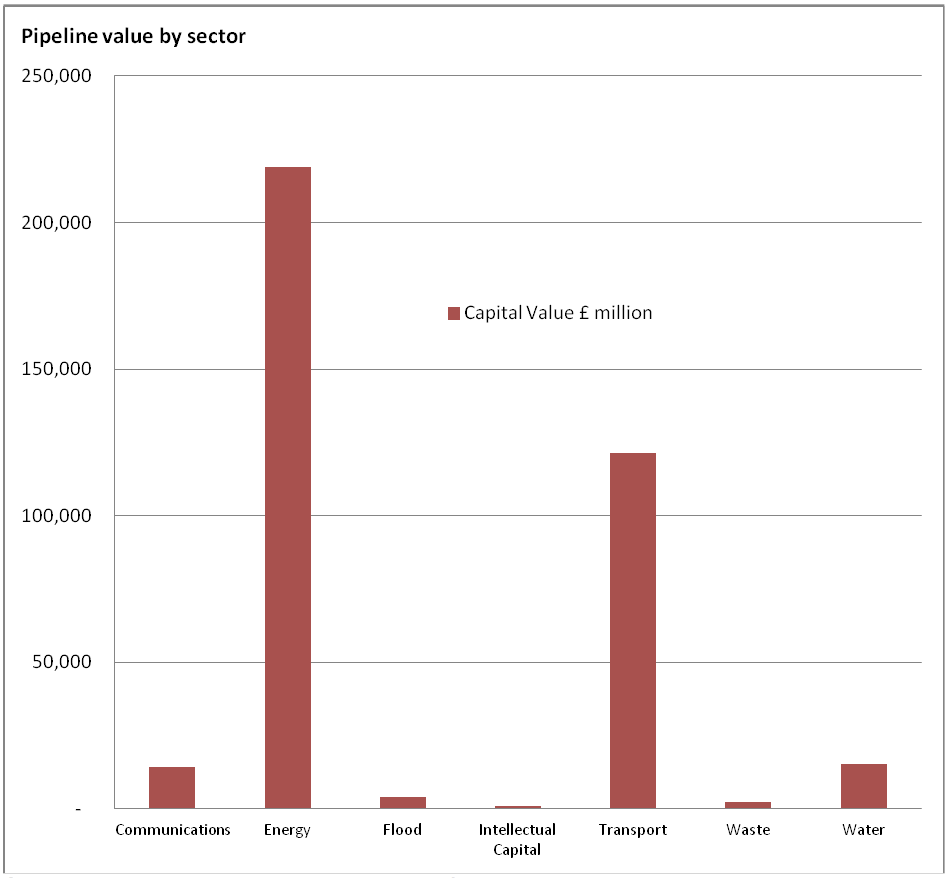
As a general principle, barcharts are only useful when zero is a relevant value, and since you can’t take the logarithm of zero, log-scale barcharts should never exist.
Thomas Lumley (@tslumley) is Professor of Biostatistics at the University of Auckland. His research interests include semiparametric models, survey sampling, statistical computing, foundations of statistics, and whatever methodological problems his medical collaborators come up with. He also blogs at Biased and Inefficient See all posts by Thomas Lumley »
Reflecting the level of intellectual capital then.
10 years ago
Also an example of what Andrew Gelman has termed “Alabama first”. I would sort them in order of smallest to largest, not alphabetically. Much better for comparisons.
10 years ago