A thousand words
Compare these two stories:
- NFL (US football) players are getting taller and heavier, with animated graph, by Noah Veltman
- Rugby players are getting bigger, by Peter Milburn
The second story actually gives more context and explanation, but the first one is (to me) more effective. It also shows something surprising: the size distribution splits into separate modes in recent years, perhaps reflecting specialisation in playing positions.
The second story actually argues that there isn’t a similar divergence in builds of rugby players, so I went to look at the data (which involved scraping it off the NZ Rugby Museum website). The pattern over time I get is (click to embiggen)
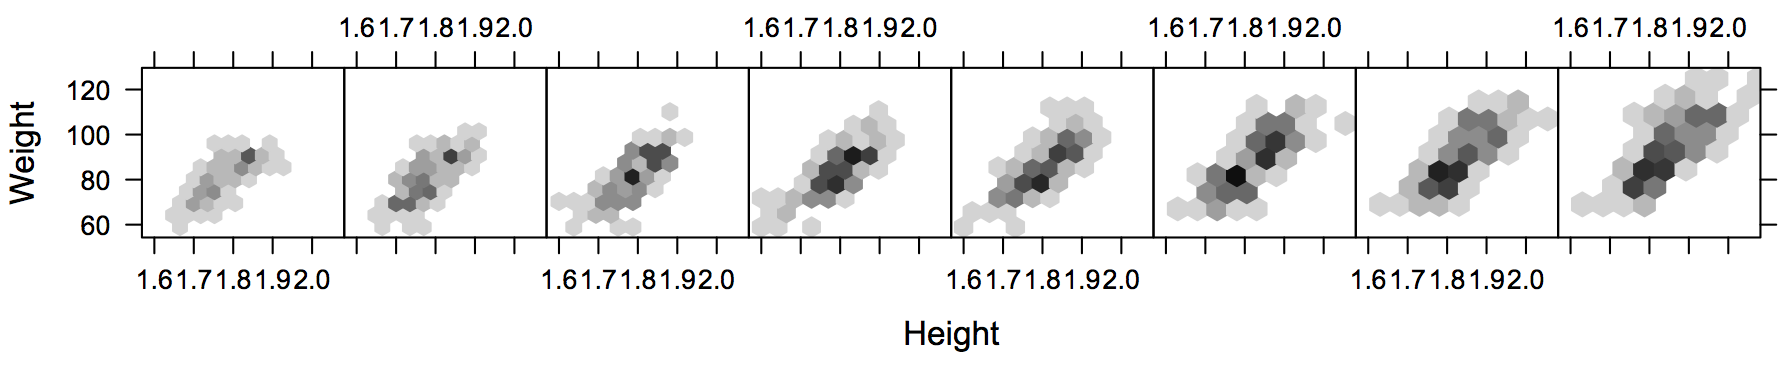
which suggests that rugby players aren’t just getting bigger, they are showing a little of the same separation into big and very big seen in the NFL players
Thomas Lumley (@tslumley) is Professor of Biostatistics at the University of Auckland. His research interests include semiparametric models, survey sampling, statistical computing, foundations of statistics, and whatever methodological problems his medical collaborators come up with. He also blogs at Biased and Inefficient See all posts by Thomas Lumley »
I don’t put a lot of store in the “official” rugby weights especially amongst the front row (although it probably doesn’t change the point you’re making over time). I think they bias them low on purpose to make the opposition over confident. Although, for the All Black Allan Hewson I’m sure they used to overestimate.
http://library.huttcity.govt.nz/docs/OPAC/images/PRFC-AllanHewson.jpg
He had guts though.
Getting big is not just for the strength and power – big muscles also protect the internal organs.
10 years ago
It would be interesting to look at the change in shape of the players against the introduction of protective clothing. Is there any evidence that the introduction of protections is associated with an increase in player size?
And it would be interesting to see if player ethnicity explains more (or less) than player position in terms of height/weight. Or how much it is confounded.
10 years ago
What are the time periods for each of the panels in that figure? They don’t seem to be labelled.
10 years ago
They are the following ranges for date of birth, each of which contains 169 players. These overlap and, yes, this is deliberate
     [,1]       [,2]
[1,] 1857-07-27 1902-01-01
[2,] 1886-04-16 1911-03-07
[3,] 1902-01-30 1924-03-05
[4,] 1911-04-13 1936-06-03
[5,] 1924-03-26 1946-04-27
[6,] 1936-08-20 1954-01-04
[7,] 1946-05-24 1963-12-17
[8,] 1954-01-07 1976-07-07
10 years ago