So, we had an election
Turnout of enrolled voters was up 3 percentage points over 2011, but enrollment was down, so as a fraction of the eligible population, turnout was only up half a percentage point.
From the Herald’s interactive, the remarkably boring trends through the count
The election in 48s. See how little movement there was over the night: http://t.co/qDBsD1lxZK
— Rowan Crawford (@wombleton) September 21, 2014
There are a few electorates that are, arguably, still uncertain, but by 9pm the main real uncertainty at the nationwide level was whether Hone Harawira would win Te Tai Tokerau, and that wasn’t going to affect who was in government. By 10pm it was pretty clear Harawira was out (though he hadn’t conceded) and that Internet Mana had been, in his opponent’s memorable phrase, “all steam and no hangi.”
Jonathan Marshall (@jmarshallnz) has posted swings in each electorate, for the party vote and electorate vote. He also has an interactive Sainte-Laguë seat allocation calculator and has published the data (complete apart from special votes) in a convenient form for y’all to play with.
David Heffernan (@kiwipollguy) collected a bunch of poll, poll average, and pundit predictions, and writes about them here. The basic summary is that they weren’t very good, though there weren’t any totally loony ones, as there were for the last US Presidential election. Our pundits seem to be moderately well calibrated to reality, but there’s a lot of uncertainty in the system and the improvement from averaging seems pretty small. The only systematic bias is that the Greens did a bit worse than expected.
Based on his criterion, which is squared prediction error scaled basically by party vote, two single polls — 3 News/Reid at the high end and Herald Digipoll at the low end — spanned almost the entire range of prediction error.
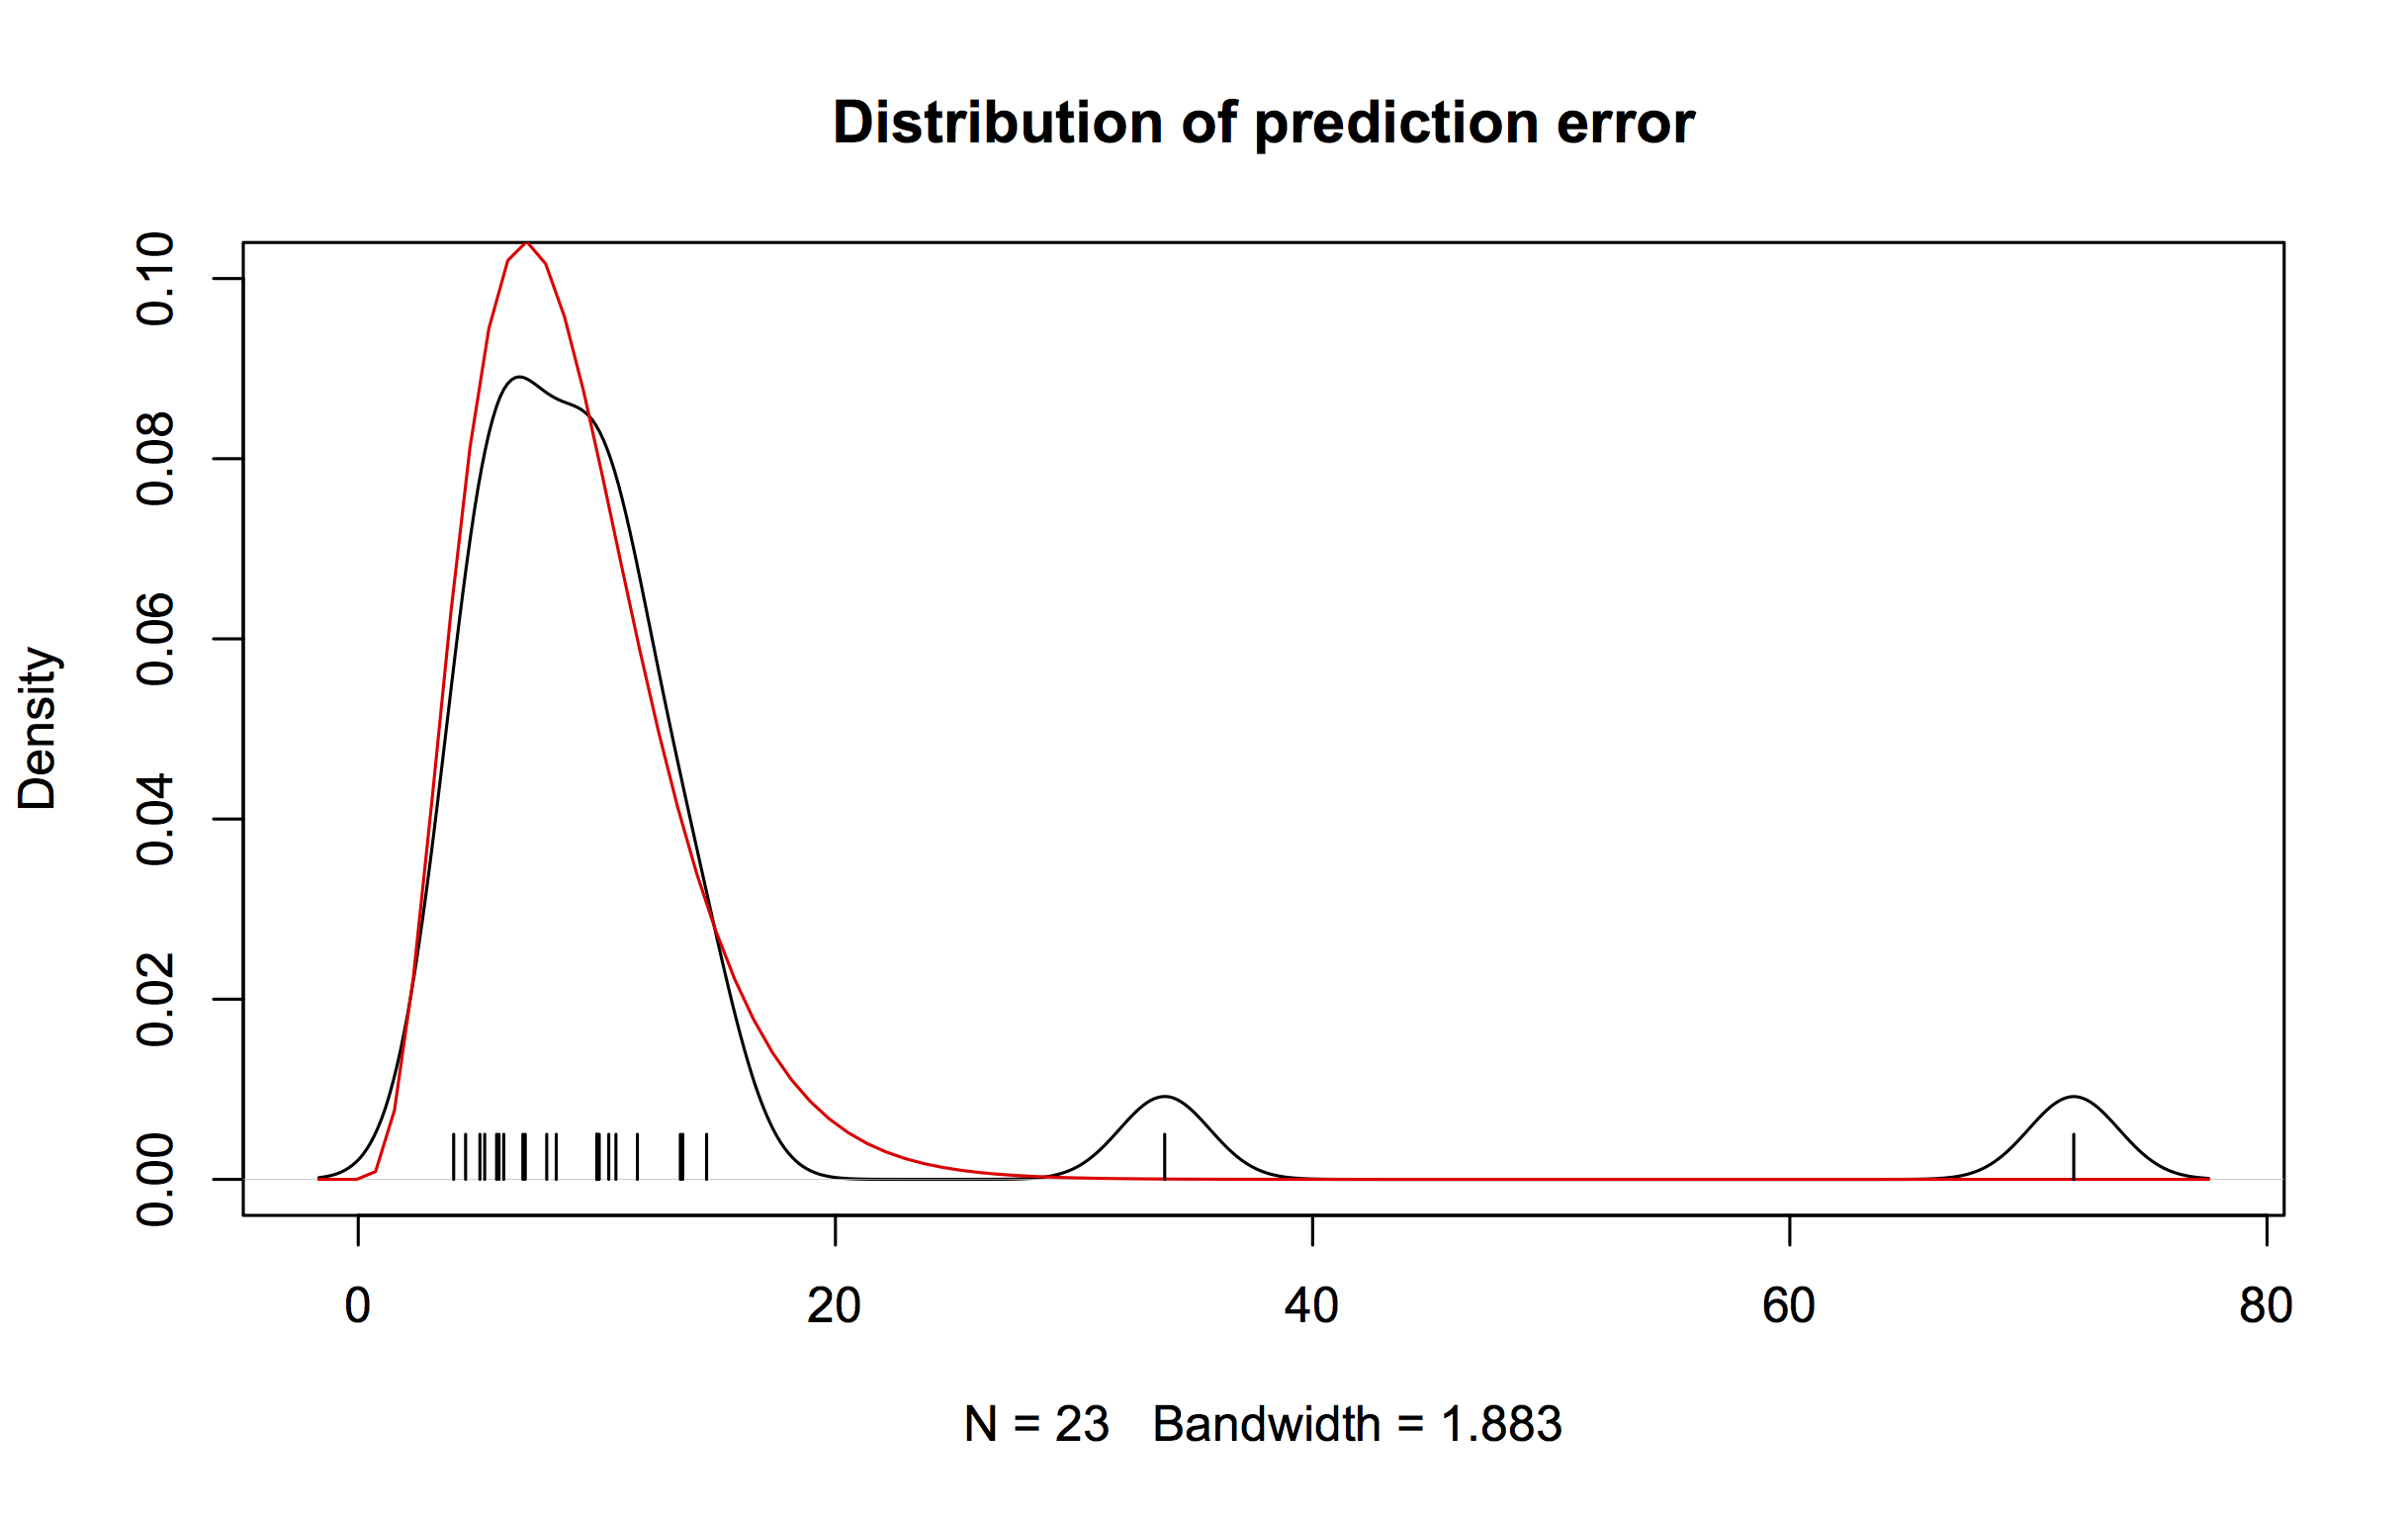
The variation between predictions isn’t actually much bigger than you’d expect by chance. The prediction errors have the mean you’d expect from a random sample of about 400 people, and apart from two outliers they have the right spread as well. On the graph, the red curve is a chi-squared distribution with 9 degrees of freedom, and the black curve is the distribution of the 23 estimates. The outliers are Wikipedia and the last 3 News/Reid Research poll.
About half the predictions were qualitatively wrong: they had National needing New Zealand First or the Conservatives for a majority. The Conservatives were clearly treated unfairly by the MMP threshold. If someone is going to be, I’m glad it’s them, but a party with more votes than the Māori Party, Internet Mana, ACT, United Future, and Legalise Cannabis put together should have a chance to prove their unsuitability in Parliament.
Thomas Lumley (@tslumley) is Professor of Biostatistics at the University of Auckland. His research interests include semiparametric models, survey sampling, statistical computing, foundations of statistics, and whatever methodological problems his medical collaborators come up with. He also blogs at Biased and Inefficient See all posts by Thomas Lumley »