Known and unknown unkowns
This graph is from the Ministry of Transport Strategic Policy Programme, looking at forecasts of demand for transport infrastructure.
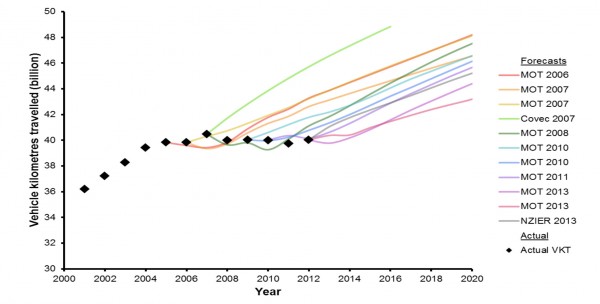
The coloured lines show forecasts of driving (billion vehicle-km) made in the past; the black diamonds show actual driving. It’s clear that actual driving flattened out about ten years ago and the forecasts didn’t. What’s not clear is the implication. It could be that the old models need to be thrown out and that increases in driving are a twentieth-century phase we’ve grown out of. Or, it could be that growth in driving will restart soon. Or something else entirely.
The MoT report very sensibly accepts that we don’t really know what’s going on, and emphasises the importance of flexibility: if you aren’t confident about the future, you should be willing to accept extra costs to avoid premature lock-in, and you should also be prepared to pay for research to get better information.
Thomas Lumley (@tslumley) is Professor of Biostatistics at the University of Auckland. His research interests include semiparametric models, survey sampling, statistical computing, foundations of statistics, and whatever methodological problems his medical collaborators come up with. He also blogs at Biased and Inefficient See all posts by Thomas Lumley »