Not net tax
But Finance Minister Bill English told Morning Report that was is not the answer, and half of all New Zealand households pay no net tax at all.
In some ways this is an improvement over one of the other version of the statistics, where it’s all households with income under $110,000 who collectively paid no net tax. It’s still misleading. It seems to be modelled on the similar figure for the US, but the NZ version is less accurate. On the other hand, the NZ version is less pernicious — unlike Mitt Romney, Bill English isn’t saying the 50% are lazy and irresponsible.
In the US figure, ‘net tax’ meant ‘net federal income tax’, ie, federal income tax minus the subset of benefits that are delivered through the tax system. In New Zealand, the figure appears to mean national income tax minus benefits delivered through the tax system (eg Working For Families tax credits) and also minus cash benefits delivered by other means. In both cases, though, the big problem is the taxes that aren’t included. In New Zealand, that’s GST.
The median household income in New Zealand is about $68,000. If we assume Mr English has done his sums correctly, this is where the ‘net tax’ starts (though the original version of the claim was 43% rather than ‘half’, which would push the cutpoint down to $50,000). Suppose the household is paying 30% of income on housing (higher than the national average), which is GST-exempt, and that they’re saving 3%, eg, through Kiwisaver (also higher than the national average). By assumption, they get back what they pay in income tax, so they spend the rest. GST on what they spend is $6834: their tax rate net of transfers is about 10%. To get a negative “net tax” you need to include some things that aren’t taxes and leave out some things that are taxes.
If you use this table from 2011, which David Farrar at Kiwiblog attributed to English’s office, it looks like many people in the $30k-$40k band will also pay tax net of transfers
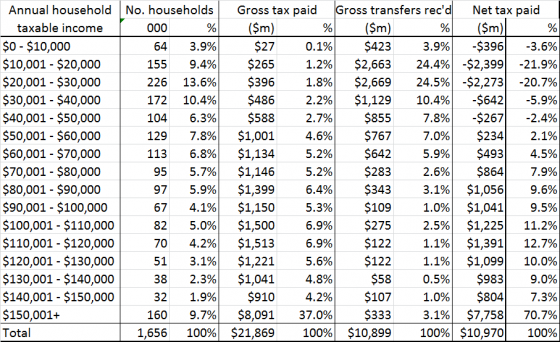
If everyone in that band was at the midpoint, and they had no tax deductions (so that the $35k taxable income is all the non-transfer income they have), the total taxable income plus gross transfers for that band is about $7150 million, and 15% of 60% of that is $643 million, so they’d have to use 40% of their money in GST-exempt ways to pay no tax net of transfers. Presumably the switch from positive to negative tax net of transfers is somewhere in this band. So, somewhere between 27% and 37% of New Zealand households pay less in tax than they receive in transfers.
Of course, cash benefits aren’t the only thing you get from the government, and more detailed modelling of where taxes are actually paid and the value of education and health benefits estimates that the lower 60% of households (adjusted for household size) get more in direct benefits and social services than they pay in direct and indirect taxes — but a lot of that is ‘getting what you pay for’, not redistribution.
Most importantly of all, there isn’t an obvious target value for the proportion of households who pay no tax net of transfers. There’s nothing obviously special about the claimed 50% or the actual 30ish%. The question is whether increasing taxes and transfers to reduce inequality would be good or bad overall, and this statistic really isn’t relevant.
Previously for this set of statistics
Thomas Lumley (@tslumley) is Professor of Biostatistics at the University of Auckland. His research interests include semiparametric models, survey sampling, statistical computing, foundations of statistics, and whatever methodological problems his medical collaborators come up with. He also blogs at Biased and Inefficient See all posts by Thomas Lumley »
I think you will find that Bill English was reflecting the Treasury’s fiscal incidence work, which does take into account both indirect taxes and also (in some measures) the provision of services.
I found some references here:
This one gives the breakdown by income decile
http://ips.ac.nz/publications/files/2d6039de603.pdf
and this one by age
http://www.victoria.ac.nz/sacl/about/cpf/publications/pdfs/WP10_2013_Distribution-Income-and-Fiscal-Incidence_18062013.pdf
9 years ago
I’m pretty sure he wasn’t.
Firstly, when he first gave those numbers, in Parliament in 2011, his office responded to David Farrar’s query with the table I reproduced above. Given the OIA, I have to assume that was in fact what he was talking about.
Secondly, the breakdown by income decile doesn’t fit any better. I have read these documents. In fact, I linked to one of them in the post. Figure 11 in the first document gives benefits received minus tax paid per decile. There are six deciles where this is positive, so the figure would be 60%, not 50% (as I said in the post). Also, the figure does take GST into account, but it also measures the benefits of all social services including health and education. It can’t reasonably be described as ‘no net tax whatsoever‘, which is what the Minister said (at 4:00 in the linked audio, emphasis in the original)
“If you’re talking about taxes, something like 10 or 20% of the taxpayers pay 75% of all tax … 50% of new zealand households pay no net tax whatsoever, so we do have a pretty redistributive system.”
He went on to say that more redistribution would be bad even for the poor overall because of its impact on economic growth, and that there were better interventions possible. That’s a case that can be made, and I’d leave arguing up to economists.
If he wants to say that 50% or 60% of NZ households get more in government services than they pay for, I’d be happy with that.
But if he says 50% of households pay no net tax whatsoever, he needs to either be a lot clearer about what he means or a lot more accurate.
9 years ago