Diversity maps
From Aaron Schiff, household income diversity at the census area level, for Auckland
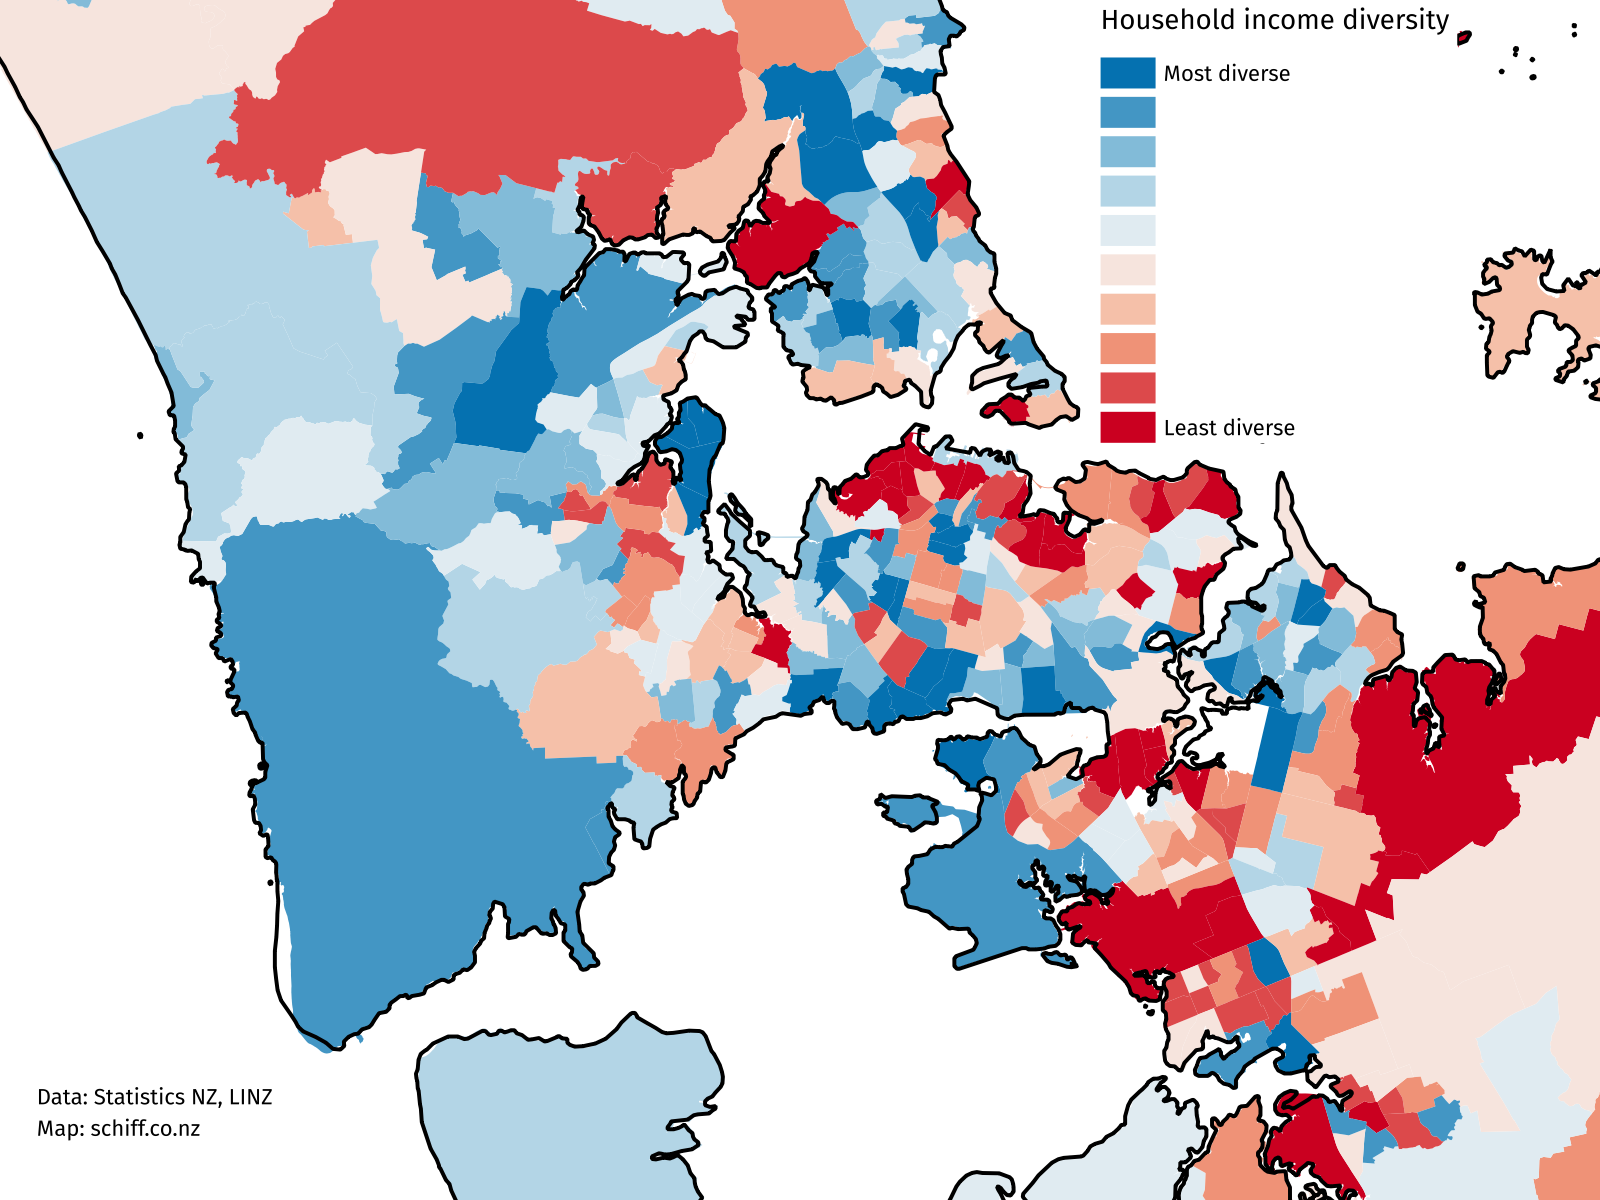
The diversity measure is based on how well the distribution of income groups in the census area unit matches the distribution across the entire Auckland region, so in a sense it’s more a representativeness measure — an area unit with only very high and very low incomes would have low diversity in this sense (but there aren’t really any). The red areas are low diversity and include the wealthy suburbs on the Waitemātā harbour and the Gulf, and the poor suburbs of south Auckland. This is an example of something that can’t be a dot map: diversity is intrinsically a property of an area, not an individual
From Luis Apiolaza, ethnic diversity in schools across the country
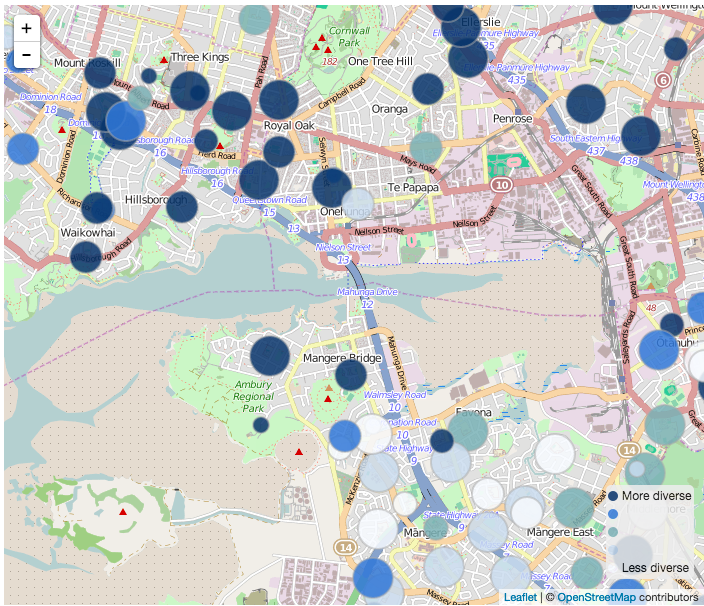
This screenshot shows an area in south Auckland, and it illustrates that ‘diversity’ really means ‘diversity’, it’s not just a code word for non-white. The low-diversity schools (white circles) in the lower half of the shot include Westmount School (99% Pākehā), but also Te Kura Māori o Ngā Tapuwae (99% Māori), and St Mary MacKillop Catholic School (90% Pasifika). The high-diversity schools in the top half of the shot don’t have a majority of students from any ethnic group.
Thomas Lumley (@tslumley) is Professor of Biostatistics at the University of Auckland. His research interests include semiparametric models, survey sampling, statistical computing, foundations of statistics, and whatever methodological problems his medical collaborators come up with. He also blogs at Biased and Inefficient See all posts by Thomas Lumley »
It would be interesting to compare the ethnic diversity of the kids in a school to the ethnic diversity of the kids’ parents.
Because of prioritised ethnicity, I would guess that the schools with high proportions of Maori and Pacific children would have a much greater diversity in parental ethnicities.
9 years ago
I’m not sure where to get the data for that, but it could be.
9 years ago
I remembered why I though that. (IIRC) In the NZ Health Survey 2006, about 30% of Pacific People born in NZ gave Euro NZ/Pakeha as another ethnicity.
And that fits with my experience of my local school.
9 years ago