Climate trends
From an interview with Robert Simmons, a data visualisation designer specialising in environmental data, this graph was created by Chloe Whiteaker (at Bloomberg) working with NASA’s Gavin Schmidt. It shows a thirty-year global temperature trend centered around each year.
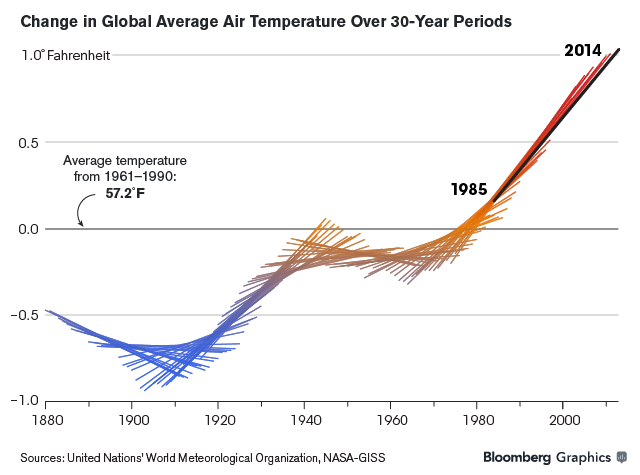
If you just plotted the central point of each line segment you’d have a ‘local linear smoother’, one of the standard ways of drawing a smooth curve through a set of data. Plotting the whole line segment makes it clearer how the curve is computed.
(via Alberto Cairo)
Thomas Lumley (@tslumley) is Professor of Biostatistics at the University of Auckland. His research interests include semiparametric models, survey sampling, statistical computing, foundations of statistics, and whatever methodological problems his medical collaborators come up with. He also blogs at Biased and Inefficient See all posts by Thomas Lumley »
The change in graph format was because the old one was embarrassing. Gavin/ Real Climate couldn’t explain the pause/hiatus over the last 15 years. Rather than explain that, the interval was pushed out to hide it. These were earlier attempts to explain it away
http://www.realclimate.org/index.php/archives/2014/01/global-temperature-2013/comment-page-2/ http://www.realclimate.org/index.php/archives/2013/12/the-global-temperature-jigsaw/
Here is the original on which the latest graph is based.
http://www.woodfortrees.org/plot/gistemp
Even the original was not from raw data but “corrected”. Here are the other two graphs using essentially the same raw data:
http://www.woodfortrees.org/plot/hadcrut4gl
http://www.woodfortrees.org/plot/best
Whenever data is smoothed, one has to look at why it is being done. The Disraeli line about, lies, damn lies and statistics comes to mind.
9 years ago
Your comment would only really make sense if the warming had in fact not continued and if you had some evidence (that you didn’t bother to link) about the intentions behind the chart.
9 years ago