Cumulative totals go up
From ThinkProgress (graph from Wikipedia) “U.S. plug-in electric vehicle cumulative sales have soared in the past few years, thanks in part to rapidly falling battery prices” and “A major reason for the rapid jump in EV sales is the rapid drop in the cost of their key component -– batteries.”
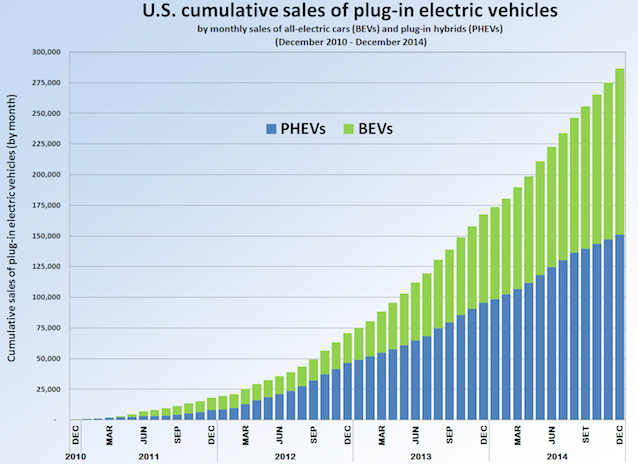
From a cumulative graph it’s hard to tell whether the cumulative sales have soared due to rapidly falling battery prices or just due to the fact that cumulative sales have to increase, but the past few years look pretty much like straight lines to me.
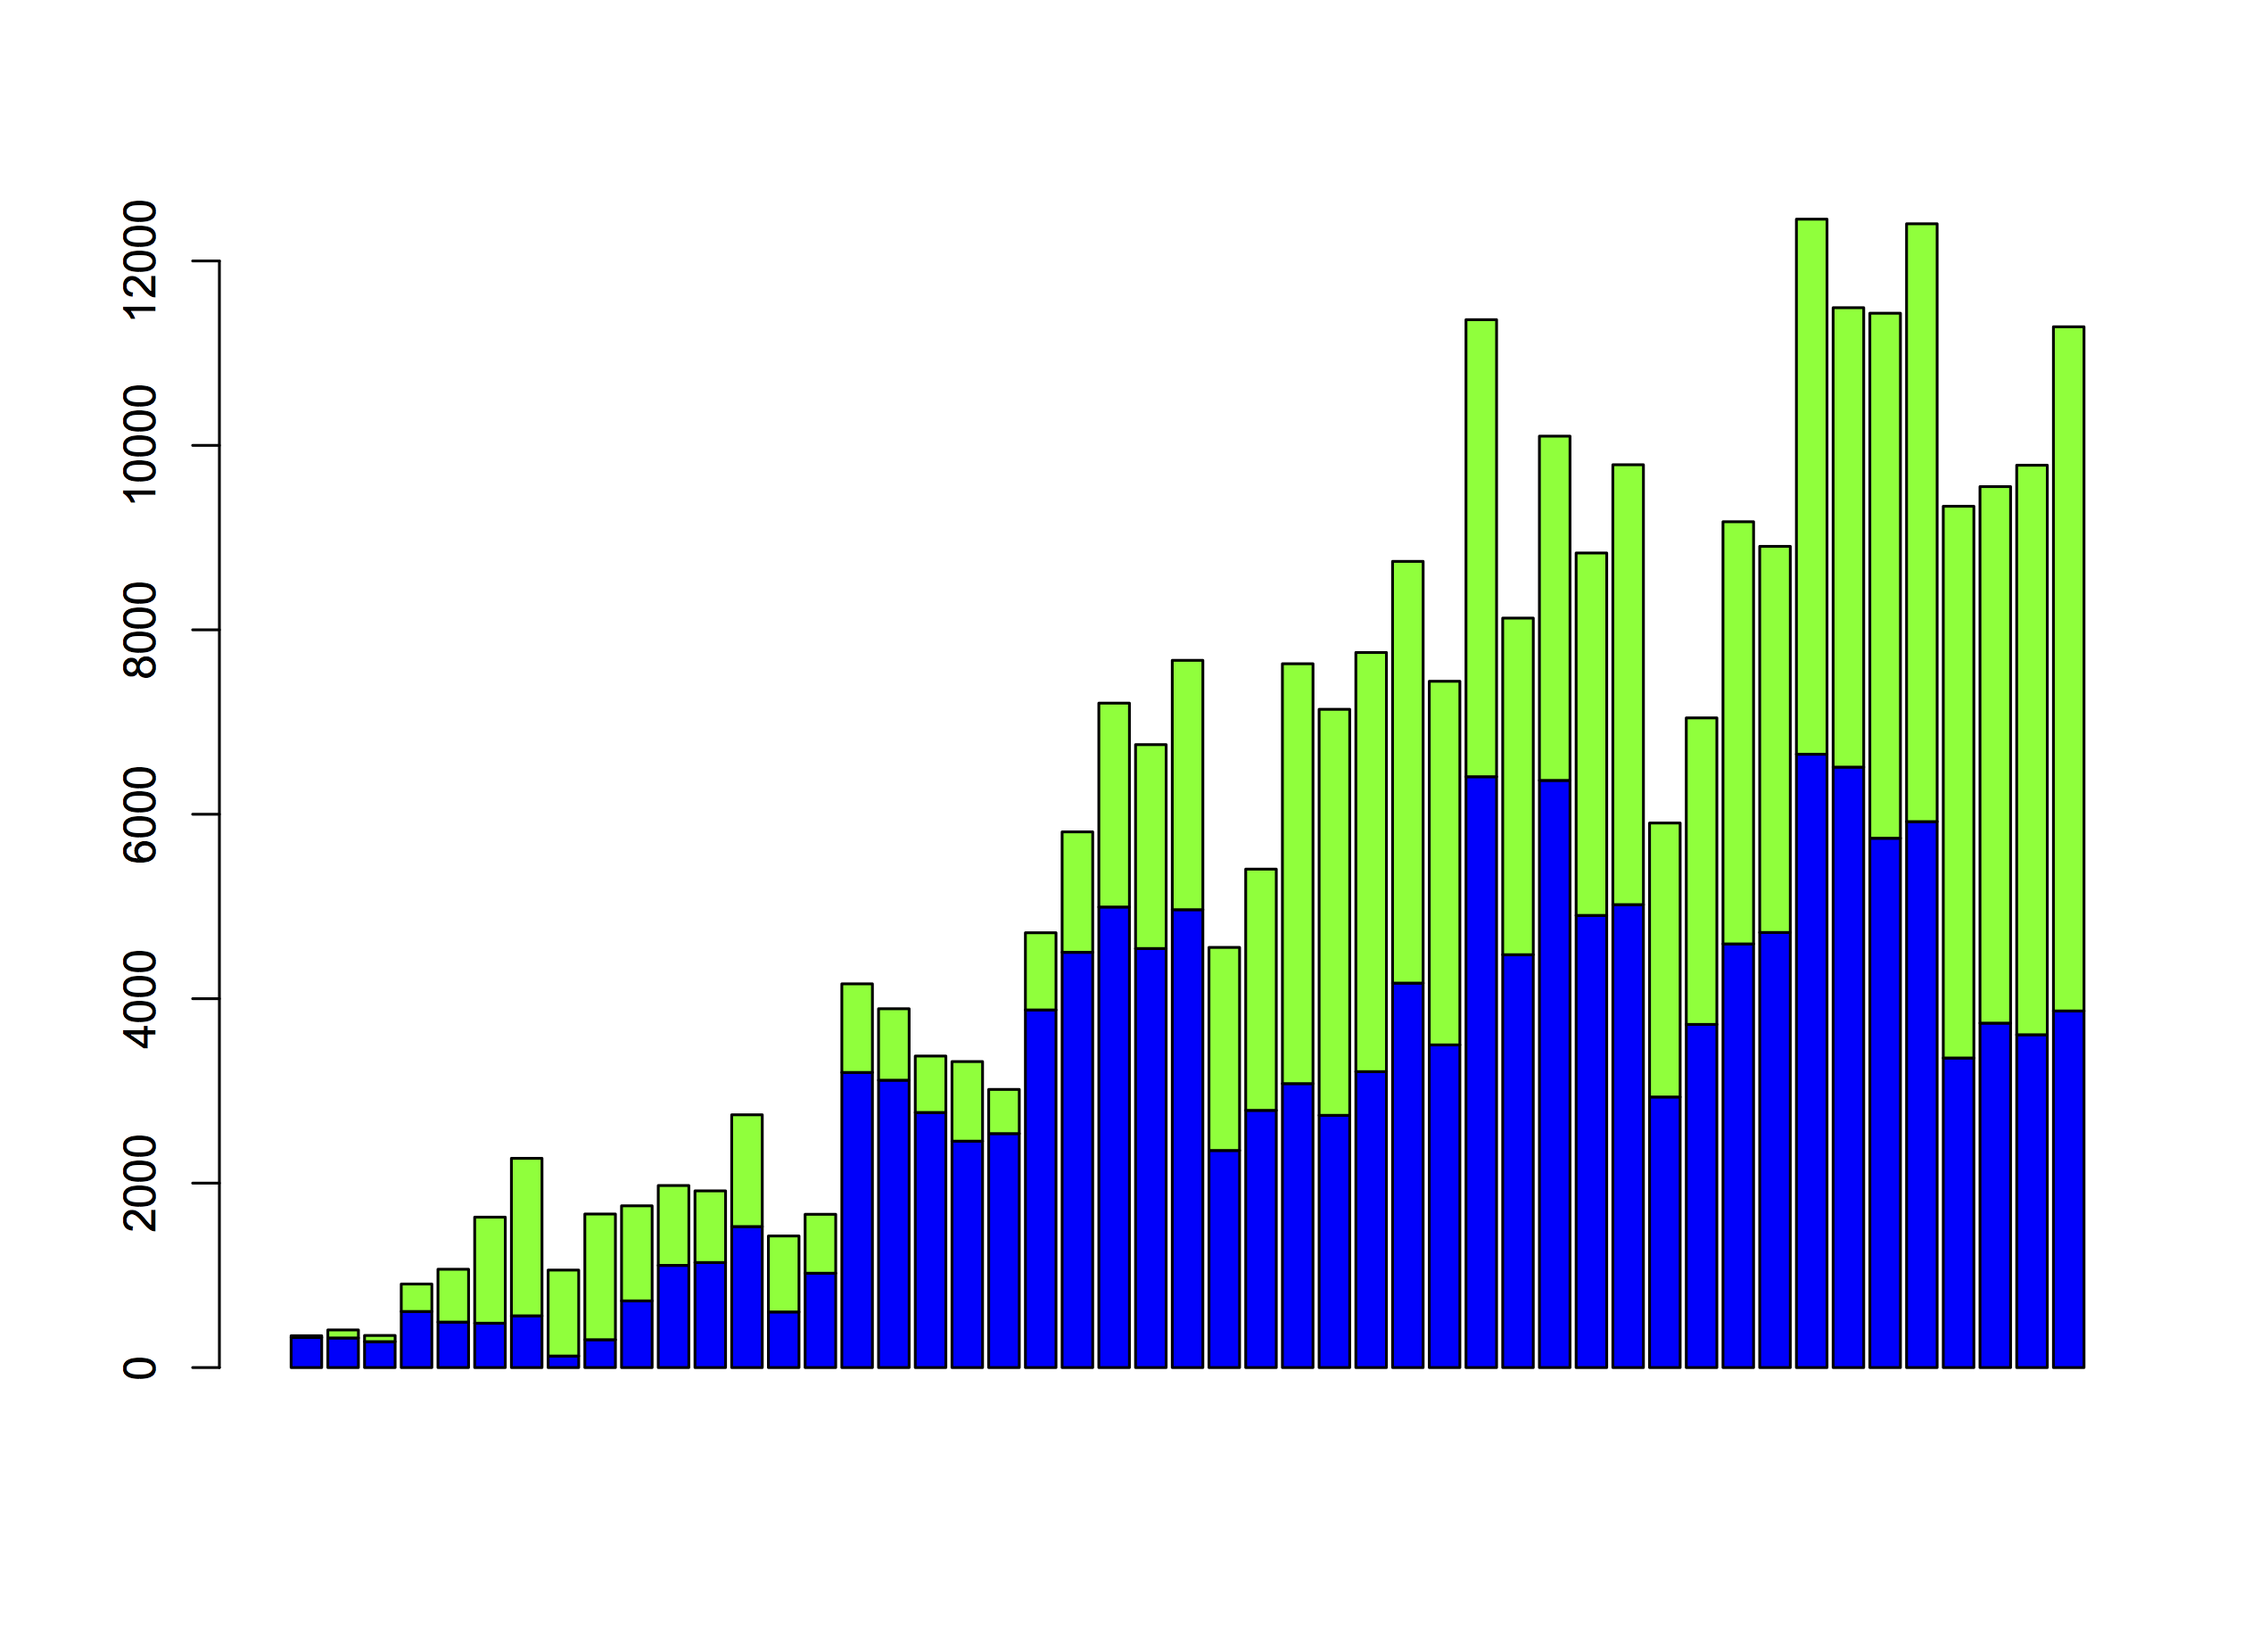
Here’s the noncumulative monthly sales, with the same colour-coding: there hasn’t been a big increase in the rate of sales during 2013 or 2014, so it’s not clear there’s much for falling battery prices to explain. Beyond the graph, for the first three months of 2015 there have been slightly few sales than in the first three months of 2014.
Cumulative sales of a new technology with sizeable network effects are important: it matters how many plug-in vehicles are out there. A cumulative graph is still a bad way to see patterns.
Thomas Lumley (@tslumley) is Professor of Biostatistics at the University of Auckland. His research interests include semiparametric models, survey sampling, statistical computing, foundations of statistics, and whatever methodological problems his medical collaborators come up with. He also blogs at Biased and Inefficient See all posts by Thomas Lumley »