Interesting graph of the day
From Matt Levine at Bloomberg
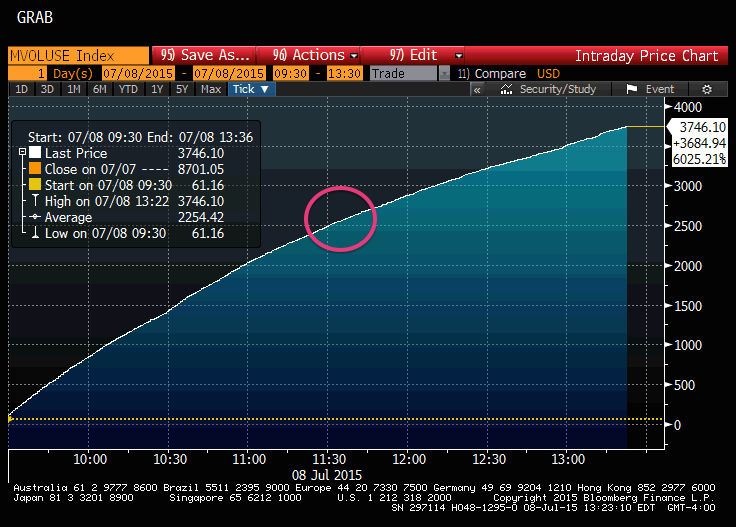
This is a graph of cumulative US stock trades today. The pink circle is centred at 11:32am, when the New York Stock Exchange had technical problems and shut down. Notice how nothing happens: the computers adapt very quickly to having a slightly smaller range of places to trade. As Levine puts it:
“For the most part the system is muddling along, relatively normally,” says a guy, and presumably if you asked a computer it would be even more chill.
Thomas Lumley (@tslumley) is Professor of Biostatistics at the University of Auckland. His research interests include semiparametric models, survey sampling, statistical computing, foundations of statistics, and whatever methodological problems his medical collaborators come up with. He also blogs at Biased and Inefficient See all posts by Thomas Lumley »