He’s a lumberjack and he’s inconsistently counted
Official statistics agencies publish lots of useful information that gets used by researchers, by educators, by businesses, by journalists, and (with the help of groups like Figure.NZ) by everyone else. A dilemma for these agencies is how to handle changes in the best ways to measure something. If you never change the definitions you get perfectly consistent reports of no-longer-useful information. If you do change the definitions, things don’t match up.
This graph is from a blog post by a Canadian economist, Liveo Di Matteo. It shows the number of Canadians employed in the lumber industry over time, patched together from several Statistics Canada time series.
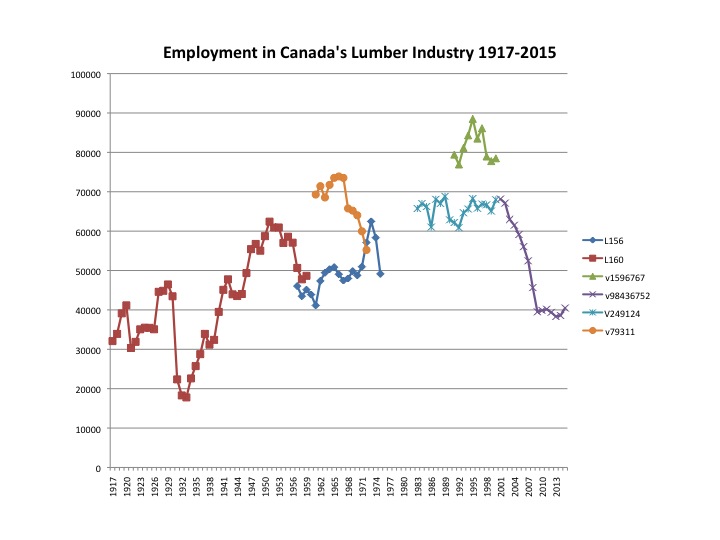
Dr Di Matteo is a professional, and wasn’t trying to do anything subtle here — he just wanted a lecture slide — and a lot of this data was from the time when Stats Canada was among the best in the world, so it’s not a problem that’s easy to avoid. It’s just harder than it sounds to define who works in the lumber industry. For example, are the log drivers in the lumber industry, or are they something like “transport workers, not elsewhere classified”?
Thomas Lumley (@tslumley) is Professor of Biostatistics at the University of Auckland. His research interests include semiparametric models, survey sampling, statistical computing, foundations of statistics, and whatever methodological problems his medical collaborators come up with. He also blogs at Biased and Inefficient See all posts by Thomas Lumley »