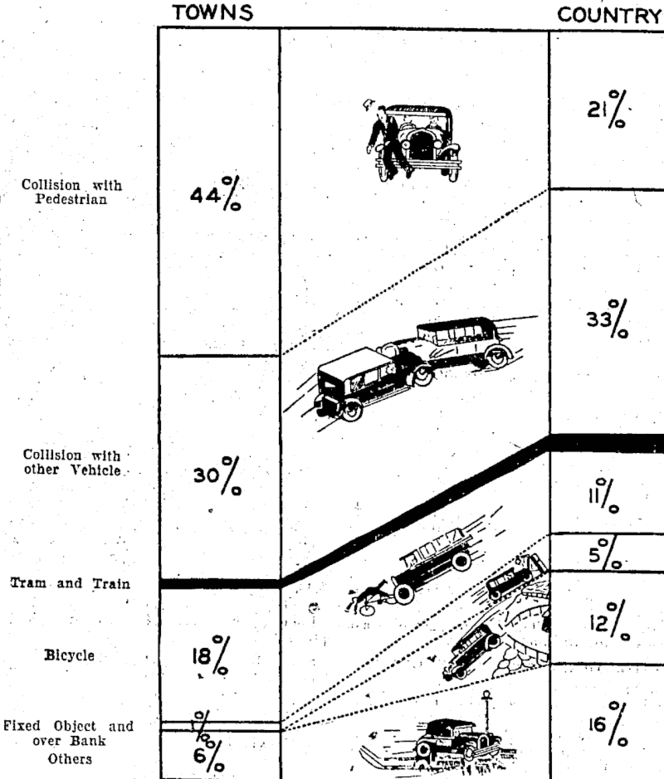
Early NZ data visualisation
From the National Library of New Zealand, via Jolisa Gracewood
Types of motor-vehicle accidents in rural areas vary considerably from those ocourrlng In urban areas, as shown in tho above chart. Tho percentages are based on figures of the Transport Department in respect of accidents causing’ fatalltles during the twelve months, April I, 1932, to March 31, 1933.
The text goes on to say “The black section representing collisions with tram and train forms only I per cent, of the whole, through this type of accident appeals to the popular Imagination’ from its spectacular nature.” Some things don’t change.
Thomas Lumley (@tslumley) is Professor of Biostatistics at the University of Auckland. His research interests include semiparametric models, survey sampling, statistical computing, foundations of statistics, and whatever methodological problems his medical collaborators come up with. He also blogs at Biased and Inefficient See all posts by Thomas Lumley »
