Garbage numbers from a high-level source
The World Economic Forum (the people who run the Davos meetings) are circulating this graph: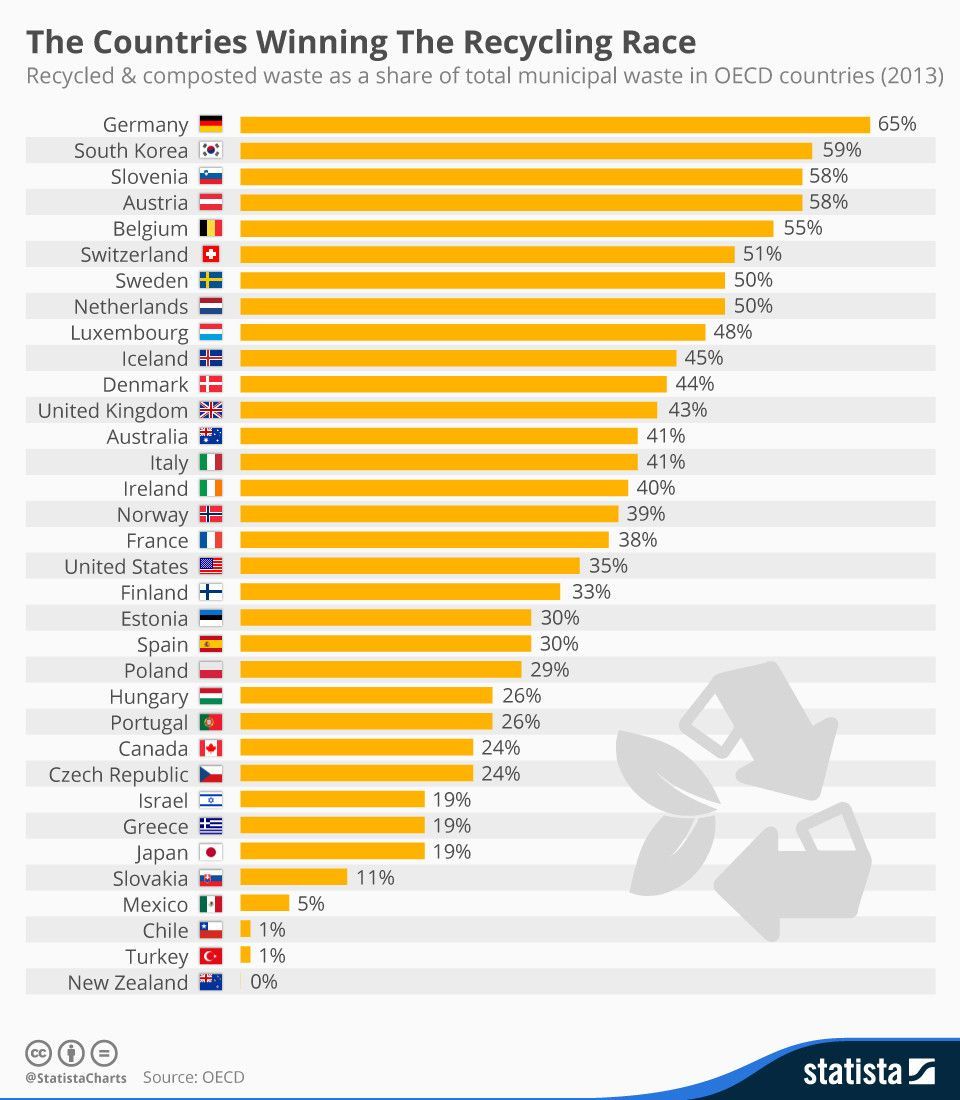
According to the graph, New Zealand is at the bottom of the OECD, with 0% waste composted or recycled. We’ve seen this graph before, with a different colour scheme. The figure for NZ is, of course, utterly bogus.
The only figure the OECD report had on New Zealand was for landfill waste, so obviously landfill waste was 100% of that figure, and other sources were 0%. If that’s the data you have available, NZ should just be left out of the graph — and one might have hoped the World Economic Forum had enough basic cluefulness to do so.
A more interesting question is what the denominator should be. The definition the OECD was going for was all waste sent for disposal from homes and from small businesses that used the same disposal systems as homes. That’s a reasonable compromise, but it’s not ideal. For example, it excludes composting at home. It also counts reuse and reduced use of recyclable or compostable materials as bad rather than good.
But if we’re trying to approximate the OECD definition, roughly where should NZ be? I can’t find figures for the whole country, but there’s some relevant –if outdated — information in Chapter 3 of the Waste Assessement for the Auckland Council Waste Management Plan. If you count just kerbside recycling pickup as a fraction of kerbside recycling+waste pickup, the diversion figure is 35%. That doesn’t count composting, and it’s from 2007-8, so it’s an underestimate. Based on this, NZ is probably between USA and Australia on the graph.
Thomas Lumley (@tslumley) is Professor of Biostatistics at the University of Auckland. His research interests include semiparametric models, survey sampling, statistical computing, foundations of statistics, and whatever methodological problems his medical collaborators come up with. He also blogs at Biased and Inefficient See all posts by Thomas Lumley »