Things to check about your bar chart
There was some discussion yesterday on Twitter about age-representativeness of Parliament.
I tweeted this graph, from a 2014 General Election summary report, after checking that the source was reputable and that the bars started at zero.
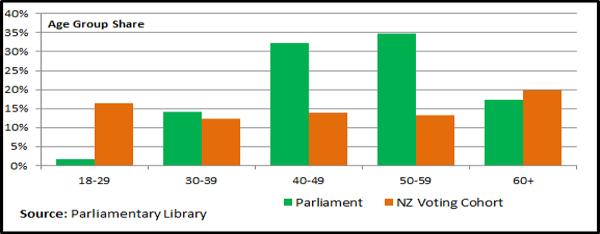
I didn’t check whether the age group shares added up to 100%. They don’t for the orange bars: it’s about 80%. That’s obviously wrong — there isn’t anywhere else for the missing 20% of people to be.
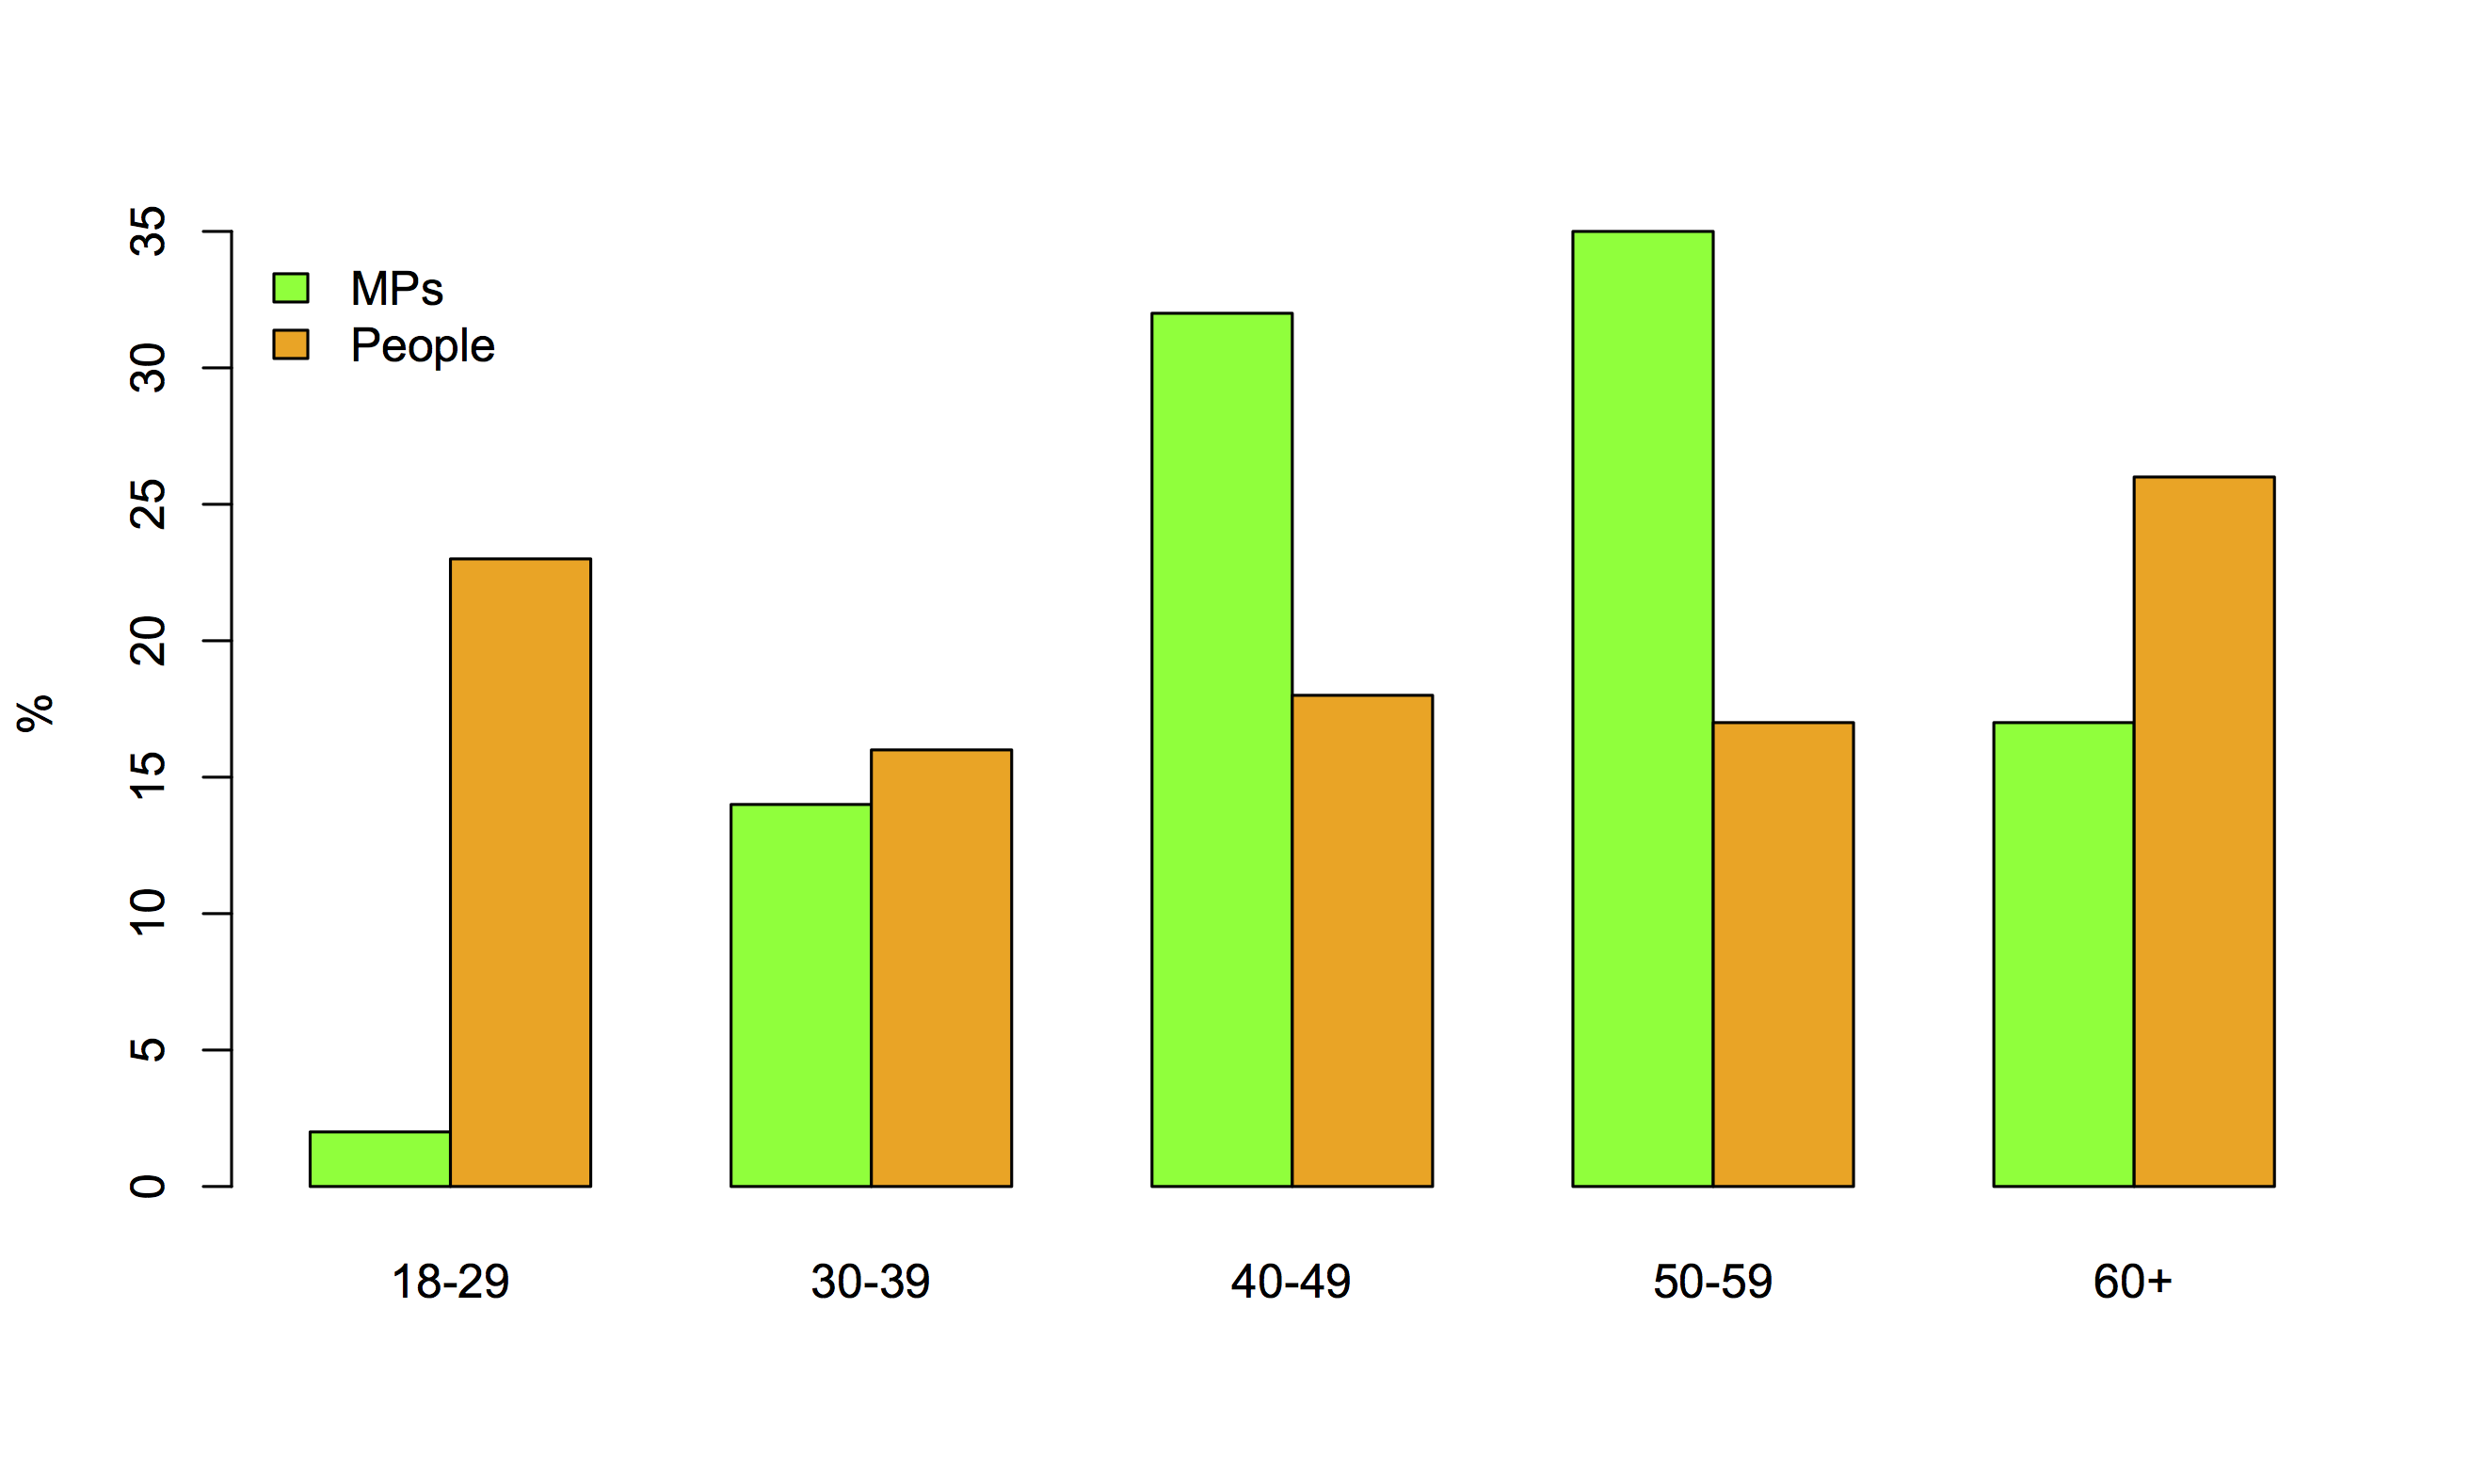
So, I found NZ population age structure data and tweeted this revision.
However, that’s the whole population and part of the point of the original graph might have been lower turnout at some ages. Here’s the graph with share of voters as well as of the population
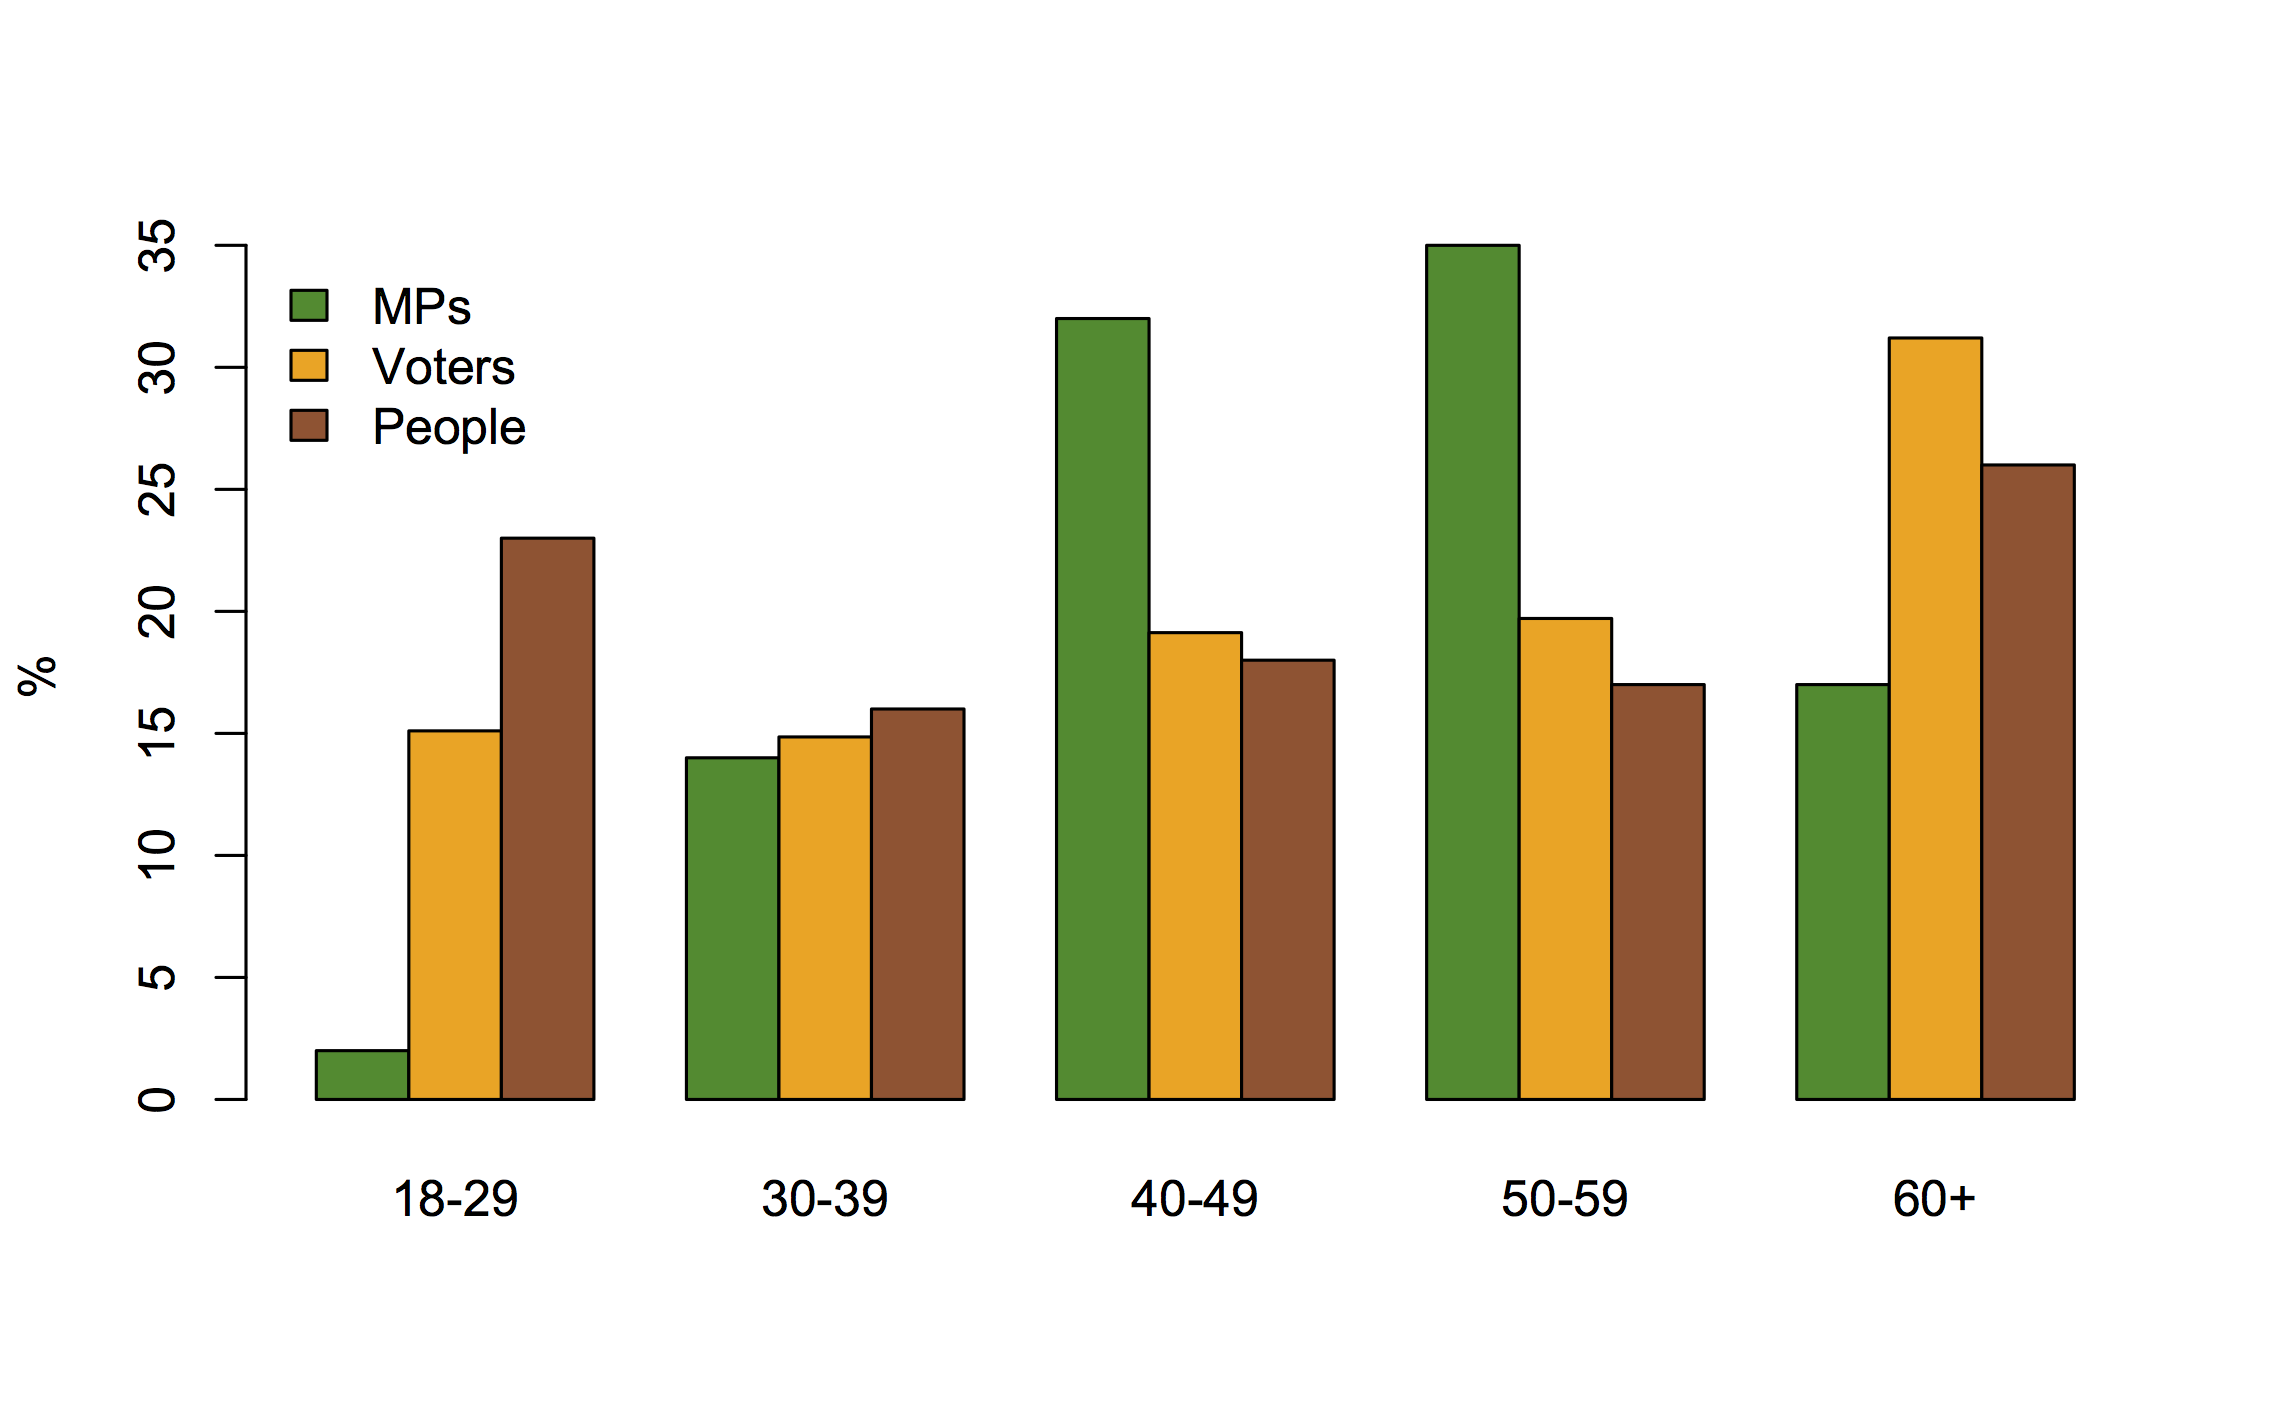
It’s not necessarily a good thing for the age distribution of voters to match that of voters or of adults in general, but if that’s what you wanted we have about the right number of thirtysomething MPs, but we have an excess in the 40-60 range and we’re missing under-30s and older people.
Compared to the population as a whole, Parliament’s also a bit low on women, immigrants, and people who think medical marijuana use should be legal.
Thomas Lumley (@tslumley) is Professor of Biostatistics at the University of Auckland. His research interests include semiparametric models, survey sampling, statistical computing, foundations of statistics, and whatever methodological problems his medical collaborators come up with. He also blogs at Biased and Inefficient See all posts by Thomas Lumley »
something wrong with “the age distribution of voters to match that of voters” in 2nd to last paragraph.
7 years ago
As an aside, one the results of looking into the UKs ‘wrong’ election polls , a factor was lumping all 60+ into one group when they found the 70+ voters were more favourable to the Conservatives.
It might be the same here, the 60-69 group may have good representation of MPs, its the 70+ group who miss out, but for obvious reasons.
7 years ago
In this case the 60-69 are still under-represented and the 70+ had no MPs.
They’ve got one now.
7 years ago
Thomas, how can the number of voters be more than the number of people in the 60+ cohort?
7 years ago
It’s not. The percentage over 60 is greater among voters than among all people.
7 years ago
OK, so are you saying that while the 60+ cohort make up 25% of the population, they make up nearly 30% of registered voters?
7 years ago
Not registered voters, people who actually voted in the election.
Part of it is registration: almost everyone over 60 is registered, and about 70% of people under 30. Part of it is turnout: more than 85% of registered voters over 60 actually voted, but less than 2/3 of registered votes under 30 actually voted.
7 years ago