Posts filed under Environment (58)

September 30, 2013

For advertising purposes only

Bogus polls are only useful for advertising, but as long as they are honest about it, that’s not a problem.

As a meritorious example, consider Forest & Bird’s Bird of the Year poll, which starts today. It exists to raise awareness of NZ birds and to get stories in the media about them, but it’s not claiming to be anything else.

At the time of writing, the kereru, ruru, and albatross were tied for first place. They’ve got more security to prevent multiple voting than the newspapers do — you can only vote once per email address — but it’s still just a self-selected poll of a tiny fraction of the population.

Radio NZ science broadcaster Allison Ballance is lobbying for the albatross, which is an excellent choice, but the only official StatsChat advice is to watch out for the penguins.

September 27, 2013

Nuclear warming?

From the Guardian, some time ago

Jeremy Clarkson had a point – and that’s not something you hear me say every day (indeed, any day) – when in a recent Sun column he challenged the scientists […] who had described a slab of ice that had broken away from Antarctica as “the size of Luxembourg”.

“I’m sorry but Luxembourg is meaningless,” said Clarkson, pointing out that the standard units of measurement in the UK are double-decker London buses, football pitches and Wales. He could have added the Isle of Wight, Olympic-sized swimming pools and Wembley stadiums to the list.

These journalist units of measurements are useful only to the extent that they are more familiar and easily understood than the actual numbers.

From The Conversation, more recently, David Holmes begins

The planet is building up heat at the equivalent of four Hiroshima bombs worth of energy every second. And 90% of that heat is going into the oceans.

This image comes originally from John Cook, who writes
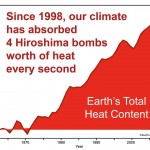
bomb

So I suggest a sticky way to communicate global warming is to express it in units of Hiroshima bombs worth of heat. This ticks all the sticky boxes:

  • It’s simple – nothing communicates a lot of heat like an A-bomb.
  • It’s unexpected – whenever I explain this to audiences, their eyes turn into saucers. Almost noone realises just how much heat our climate system is accumulating.
  • It’s concrete – nobody has trouble conceptualising an A-bomb. Well, much of the younger generation don’t know about Hiroshima – when I test-drived this metaphor on my teenage daughter, she asked “what’s Hiroshima?”. But it’s easily recommunicated as an atomic bomb.
  • It tells a story – the idea that second after second, day after day, the greenhouse effect continues to blaze away and our planet continues to build up heat.
  • The only downside of this metaphor is it is emotional – the Hiroshima bomb does come with a lot of baggage. However, this metaphor isn’t used because it’s scary – it’s simply about communicating the sheer amount of heat that our climate is accumulating. I’ve yet to encounter a stickier way of communicating the scale of the planet’s energy imbalance.

I think he’s wrong about the  downside.  The real downside is that the image of Hiroshima has nothing to do with heat production.  The Hiroshima bomb was important because it killed lots of people, many of them civilians, ended the war, and ushered in the age of nuclear weapons where a small number of military or political leaders had the ability to destroy industrial civilisation and kill the majority of our species (which nearly happened, 30 years ago today).

If we set off four Hiroshima-scale bombs per second, global warming would become a relatively unimportant side issue — and in fact, nuclear weapons are much more widely associated with nuclear winter.

You could also invoke public health concerns and describe the heat accumulation as equivalent to everyone in the world smoking seven cigarettes per second (1185 cal/cig: data). That would be wrong in the same ways.

September 19, 2013

Briefly

  • An interactive graphic showing variation as well as trends in unemployment in the US. From eager eyes
  • Some people just can’t do simple mathematical computations, but  for those that can, they can easily be distracted by political bias. Grist describes a nice experiment by psychologist Dan Kahan and colleagues
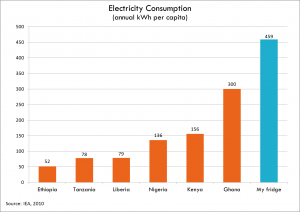
  • Your refrigerator uses more power than many people in AfricaElectricity-consumption-Todd-Moss
September 13, 2013

Stats on Radio NZ

Last night’s edition of Our Changing World had two segments by University of Auckland statisticians called James.

Allison Ballance and James Russell talked about seabirds and rat eradication


Ruth Beran and James Curran talked about forensic statistics


August 18, 2013

Correlation, genetics, and causation

There’s an interesting piece on cannabis risks at Project Syndicate. One of the things they look at is the correlation between frequent cannabis use and psychosis.  Many people are, quite rightly, unimpressed with the sort of correlation, since it isn’t hard to come up with explanations for psychosis causing cannabis use or for other factors causing both.

However, there is also some genetic data.  The added risk of psychosis seems to be confined to people with two copies of a particular genetic variant in a gene called AKT1. This is harder to explain as confounding (assuming the genetics has been done right), and is one of the things genetics is useful for. This isn’t just a one-off finding; it was found in one study and replicated in another.

On the other hand, the gene AKT1 doesn’t seem to be very active in brain cells, making it more likely that the finding is just a coincidence.  This is one of the things bioinformatics is good for.

In times like these it’s good to remember Ben Goldacre’s slogan “I think you’ll find it’s a bit more complicated than that.”

August 17, 2013

How to lie with barcharts

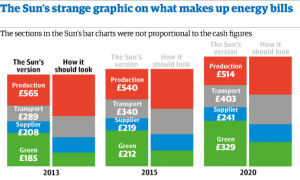
From the Guardian, a story about a barchart in the Sun portraying the cost of ‘green energy’

SUN_GREEN_BARCHART_3007

July 12, 2013

In real terms

From @LIVENewsDesk on Twitter, and then Stuff, we have record nominal prices for petrol.

Adjusted for inflation, the price is still definitely lower than in mid-2008, when it got to $2.18, which is $2.41 in today’s money, and driving is much cheaper than in was in the mid-1980s.

Also, neither Stuff nor the AA still seem to know about the government’s independent petrol-price monitoring system. Their estimate of the importer margin has been stable since May, but is well above recent historical levels.

July 3, 2013

Data sonification

An interestesting video from the Geography department at the University of Minnesota. The cellist, Minnesota student Daniel Crawford, plays the historical earth mean temperature record converted to music

One difficulty with sonic display of data is scaling: the video uses a semitone for 0.03 Celsius, but that seems like quite a big pitch change for a barely-measurable temperature difference.  The scaling gives a range of three octaves (rather more than a typical singers voice) for just over 1 degree, which is a meaningful but not catastrophic change in temperature.  I think it’s fair to say the pitch scaling is a bit exaggerated.

It’s hard to say what would be appropriate, since we don’t have the research and practical experience that informs axis choices for graphs.  One approach might be to take advantage of vibrato in cello performance, and scale so that the minimum measurement uncertainty is the same as the vibrato variation.  The Google suggests that cello vibrato is about 1/5 to 1/4 semitone, and mapping this to a minimum confidence interval width (from the Berkeley data) of 0.04C gives a scaling of 0.16 to 0.2 degrees per semitone, or a total range for the whole piece of about half an octave.

May 6, 2013

Some surprising things

  • From Felix Salmon: US population is increasing, and people are moving to the cities, so why is (sufficiently fine-scale) population density going down? Because rich people take up more space and fight for stricter zoning.  You’ve heard of NIMBYs, but perhaps not of BANANAs
  • From the New York Times.  One of the big credit-rating companies is no longer using debts referred for collection as an indicator, as long as they end up paid.  This isn’t a new spark of moral feeling, it’s just for better prediction.
  • And from Felix Salmon again: Firstly, Americans are bad at statistics. When it comes to breast cancer, they massively overestimate the probability that early diagnosis and treatment will lead to a cure, while they also massively underestimate the probability that an undetected cancer will turn out to be harmless.
March 26, 2013

Salience bias

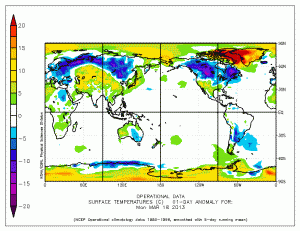
There’s been a lot of news recently about cold weather and snow in parts of the far Northern hemisphere that have  people living in them, especially English-speaking people.   As has typically happened with newsworthy cold snaps in recent years, this is balanced by unseasonably warm weather in parts of the far North that don’t have many  people living in them.

33


There are good reasons why the TV news doesn’t have much coverage of unseasonably warm weather in northern Greenland and the Arctic icecap. For a start, the local broadcasting infrastructure sucks.  It’s still important to remember that we only hear about weather in a fairly small fraction of the world.