Road deaths up
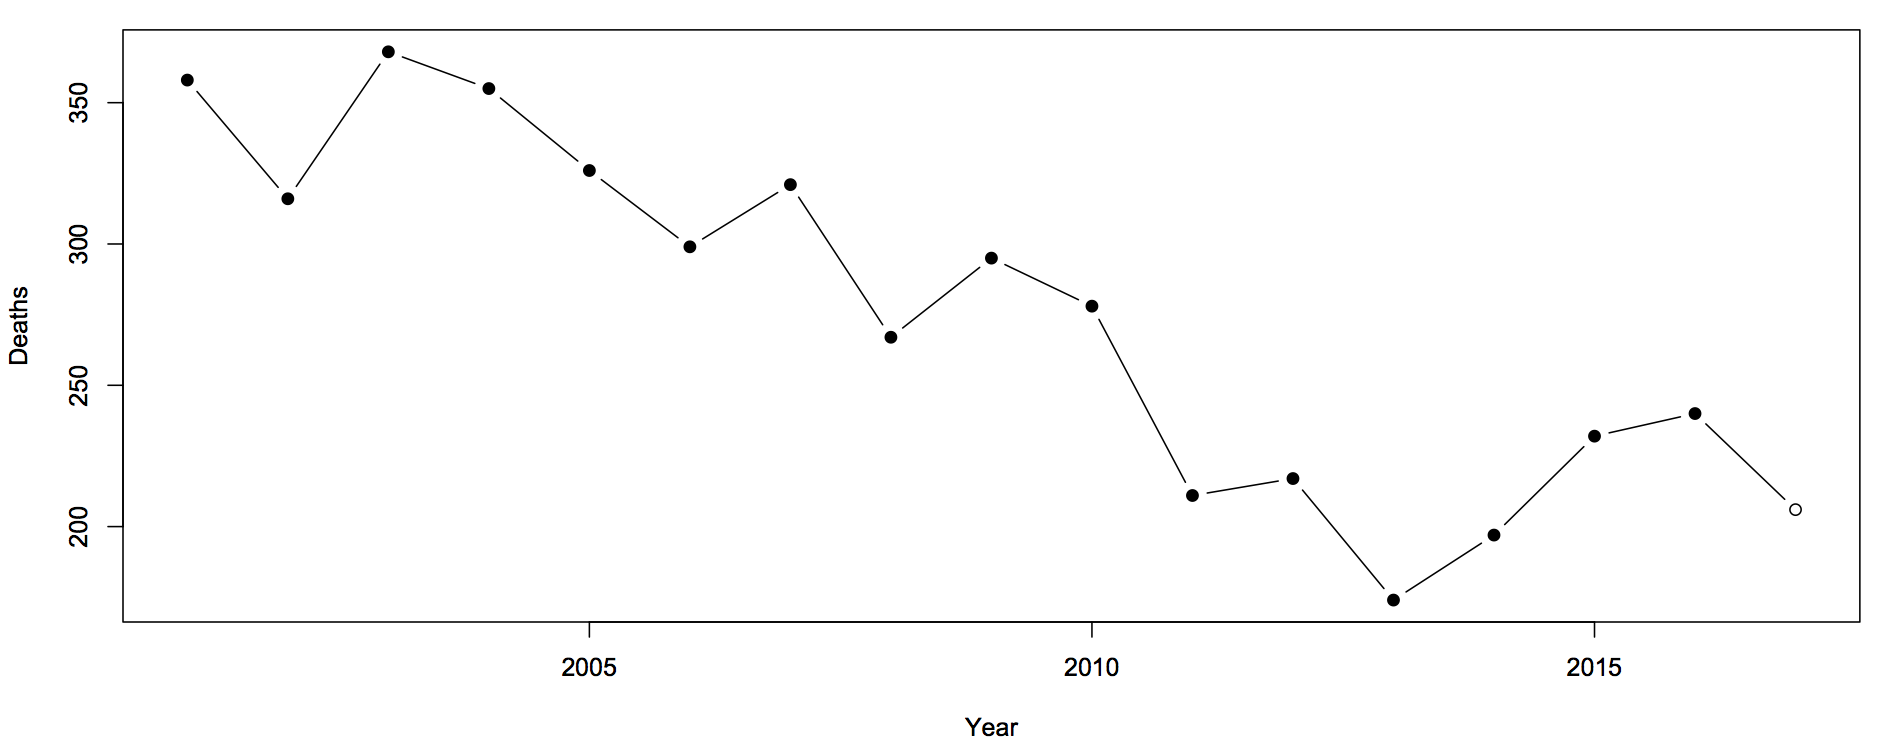
Sam Warburton (the economist, not the rugby player) has been writing about the recent increase in road deaths. Here are the counts (with partial 2017 data)
The first question you should ask is whether this is explained by population increases or by driving increases. That is, we want rates — deaths per unit of distance travelled
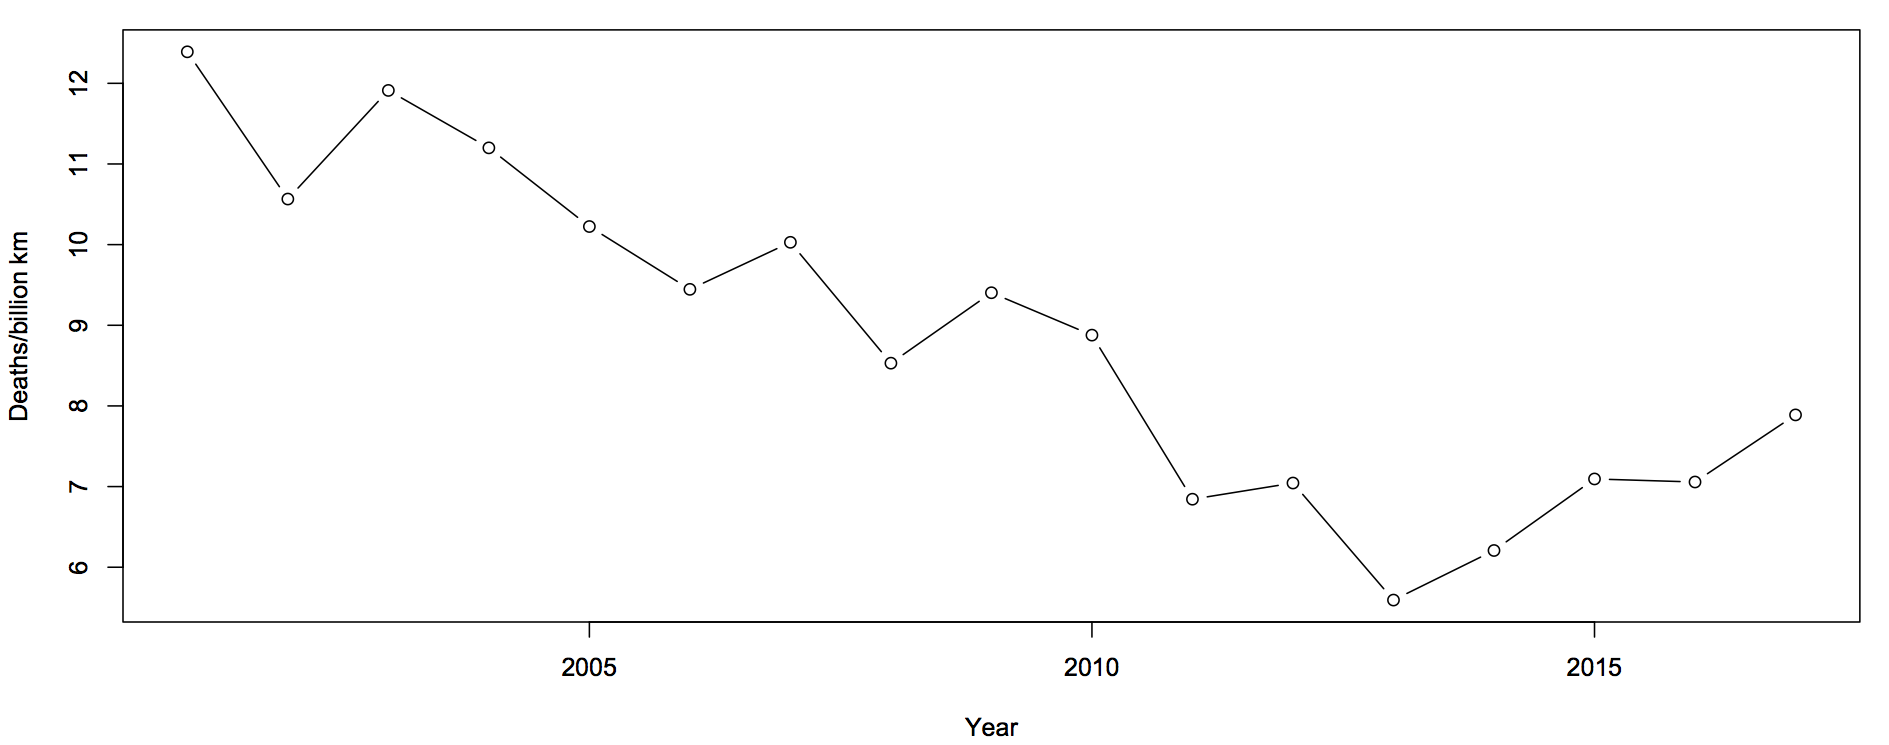
There’s still an increase, but now the 2017 partial data are in line with the increase. The increase cannot be explained simply by more cars being on the roads.
The next question is about uncertainty. Traditionally, news stories about the road toll were based on one month of data and random variation could explain it all. We still need a model for how much random variation to expect. What I said before was
The simplest mathematical model for counts is the Poisson process. If dying in a car crash is independent for any two people in NZ, and the chance is small for any person (but not necessarily the same for different people) then number of deaths over any specified time period will follow a Poisson distribution. The model cannot be exactly right — multiple fatalities would be much rarer if it were — but it is a good approximation, and any more detailed model would lead to more random variation in the road toll than the Poisson process does.
In that case I was arguing that there wasn’t any real evidence of a change, so using an underestimate of the random variation made my case harder. In this case I’m arguing the change is larger than random variation, so I need to make sure I don’t underestimate random variation.
What I did was fit a Bayesian model with two extra random components. The first was the trend over time. To avoid making assumptions about the shape of the trend I just assumed that the difference between adjacent years was relatively small and random. The second random component was a difference between the trend value for a year and the ‘true’ rate for that year. On top of all of that, there’s Poisson variation. Since the size of the two additional random components is estimated from the data, they will capture all the variation.
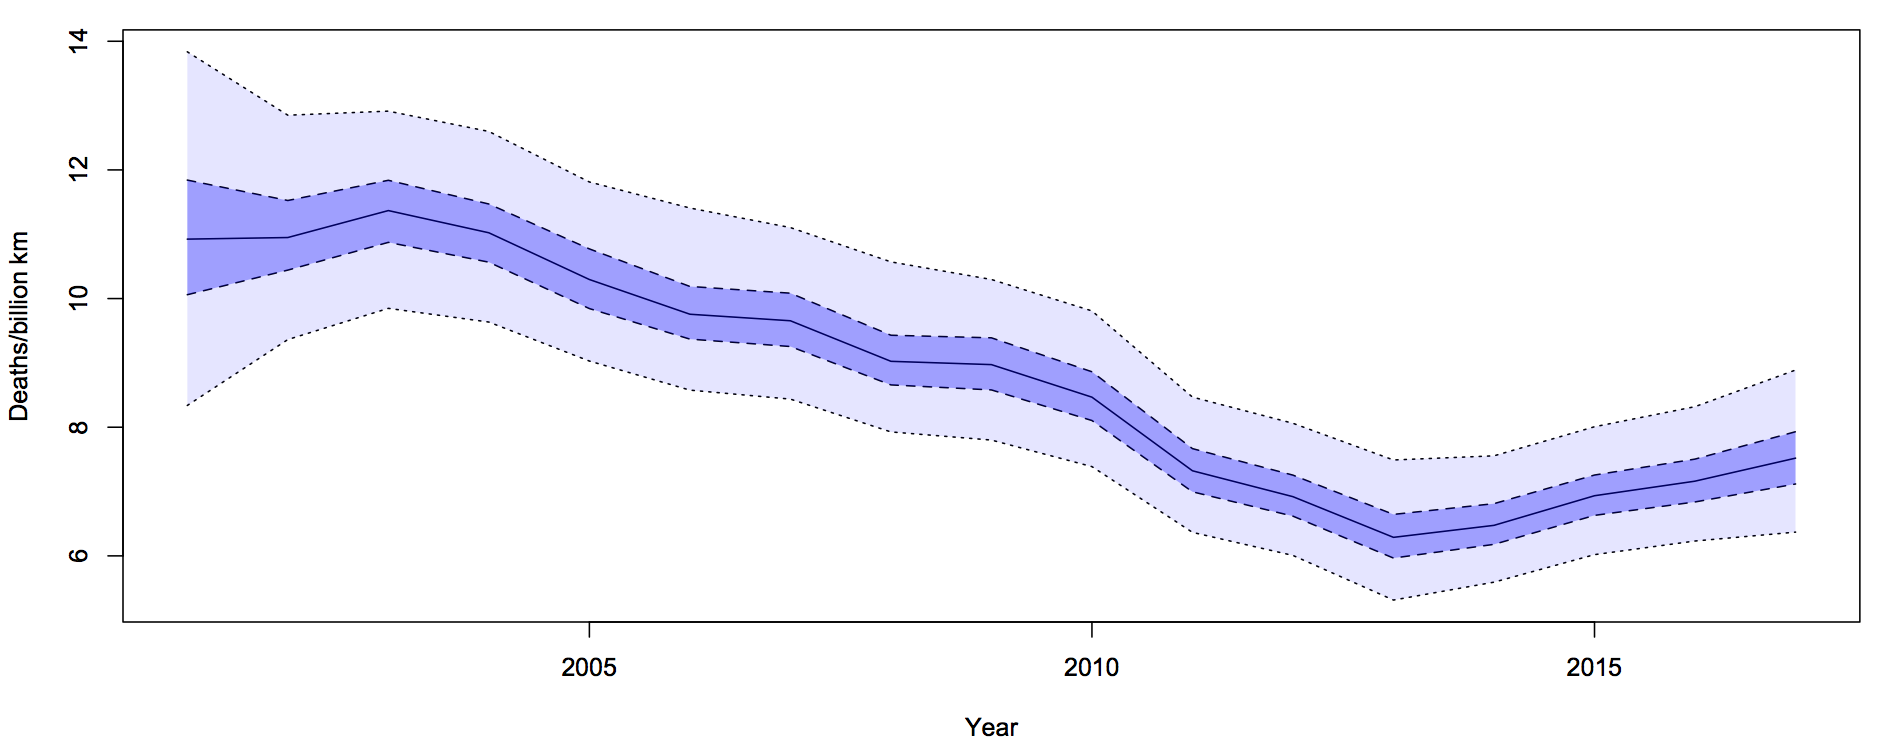
For each year, there is a 50% probability that the underlying rate is in the darker blue interval, and a 95% probability it’s in the light blue interval. The trend is smoother than the data because the data has both the Poisson variation and the extra year-specific deviation. There’s more uncertainty in 2001 because we didn’t use pre-2001 data to tie it down at all, but that won’t affect the later half of the time period much.
It looks from the graph as though there was a minimum in 2013-14 and an increased rate since then. One of the nice things about these Bayesian models is that you can easily and meaningfully ask for the probability that each year was the minimum. The probability is 54% for 2013 and 27% for 2014: there really was a minimum around then.
The probability that the rate is higher in 2017 than in 2013 is over 90%. This one isn’t just random variation, and it isn’t population increase.
Update: Peter Ellis, who has more experience with NZ official statistics and with Bayesian state-space time series models, gets qualitatively similar results
Thomas Lumley (@tslumley) is Professor of Biostatistics at the University of Auckland. His research interests include semiparametric models, survey sampling, statistical computing, foundations of statistics, and whatever methodological problems his medical collaborators come up with. He also blogs at Biased and Inefficient See all posts by Thomas Lumley »
Interestingly, there was a change in the give way rules in March, 2012.
https://www.nzta.govt.nz/driver-licences/getting-a-licence/road-code/give-way-rule-changes-2012/
7 years ago
Draw a line from 2010 to 2016 and you will see that it is the period from 2010 to 2016 that is the outlier, not the 2013 to 2017 period.
In 2010 “safer journeys” was introduced. This was a period of intense publicity and policing.
My hypothesis is that the effects of this strategy are now wearing off and the trend is back to its long term rate – a slow decrease (or the inevitable leveling off) for which 2017 is an upwards blip.
7 years ago
I don’t think so. There’s been a decades-long downward trend – well before Safer Journeys. A period of increase is counter that, not a period of continued decrease.
Serious injuries show the same pattern. Decline. Increase from 2013/14.
7 years ago
I’m actually quite swayed by Tony’s argument.
It’s consistent with a flattening between 2013 and 2016 due to the “ghost chips” ads plus an uptick in 2017 due to the diabolical weather this year.
On the other hand, according to the grapevine, at about the same as that campaign the police reduced their investment into policing drink driving.
It would be interesting to look at this by age – you’d expect the ghost chip ads to primarily effect the young – although it would have to be with population at the denominator rather than km’s driven.
7 years ago