How many omicrons?
Radio NZ has a headline Omicron: Modelling suggests NZ could face peak of 80,000 daily infections, and the report starts “New Zealand could be facing 50,000 daily Omicron infections by Waitangi weekend”. This is technically correct, but in this context that is not the best kind of correct.
First, this is a model for infections, not cases. It includes asymptomatic infections (which are definitely a thing) and infections that just don’t get reported. The modelled peak for cases is a couple of weeks later, and about a factor of 7 lower. So 50,000 daily infections by Waitangi weekend, peaking at 80,000 a few weeks later means 425 daily cases by Waitangi weekend, peaking around 11,000 daily cases by late March, if we believe the model. Given that we have been seeing reporting of cases, not infections, for the past two years, it’s misleading to quote a number that’s twice as soon and an order of magnitude higher.
Is it realistic that so many cases get unreported? It’s not clear. The best data on this, according to Trevor Bedford, who knows from Covid, is from the UK, where they have a mail-out prevalence survey. He estimates that the UK reports about 3 in 10 cases, and thinks it would be a bit lower for the US. I’d be surprised if it’s lower than the UK here, at least for the next few weeks. So, that conflicts a bit with the IHME infections model.
So, is the model right? Well, on the one hand, it’s a serious effort at modelling and should be taken seriously. On the other hand, it’s a model for everywhere in the world, so the amount of attention given to New Zealand data and outcomes will be quite limited. The NZ modellers put rather more effort into modelling New Zealand data and New Zealand policies.
The reasons that New Zealand eventually controlled our Delta outbreak were specific to New Zealand: lots of new vaccinations, quite good adherence to interventions, being happy to take it outside, being on a small island in the tropics, whatever. This sort of thing is hard for a worldwide model to pick up. As Radio NZ says, the model has a prediction if we use masks, and a prediction if everyone gets boostered; these are lower. It doesn’t have a prediction that accounts for capacity restrictions or vaccination of children. It’s a model where ‘flattening the curve’ fails completely.
Looking at the model in more detail, it does seem that there are some issues with the NZ data feeds. The model for testing looks like this:
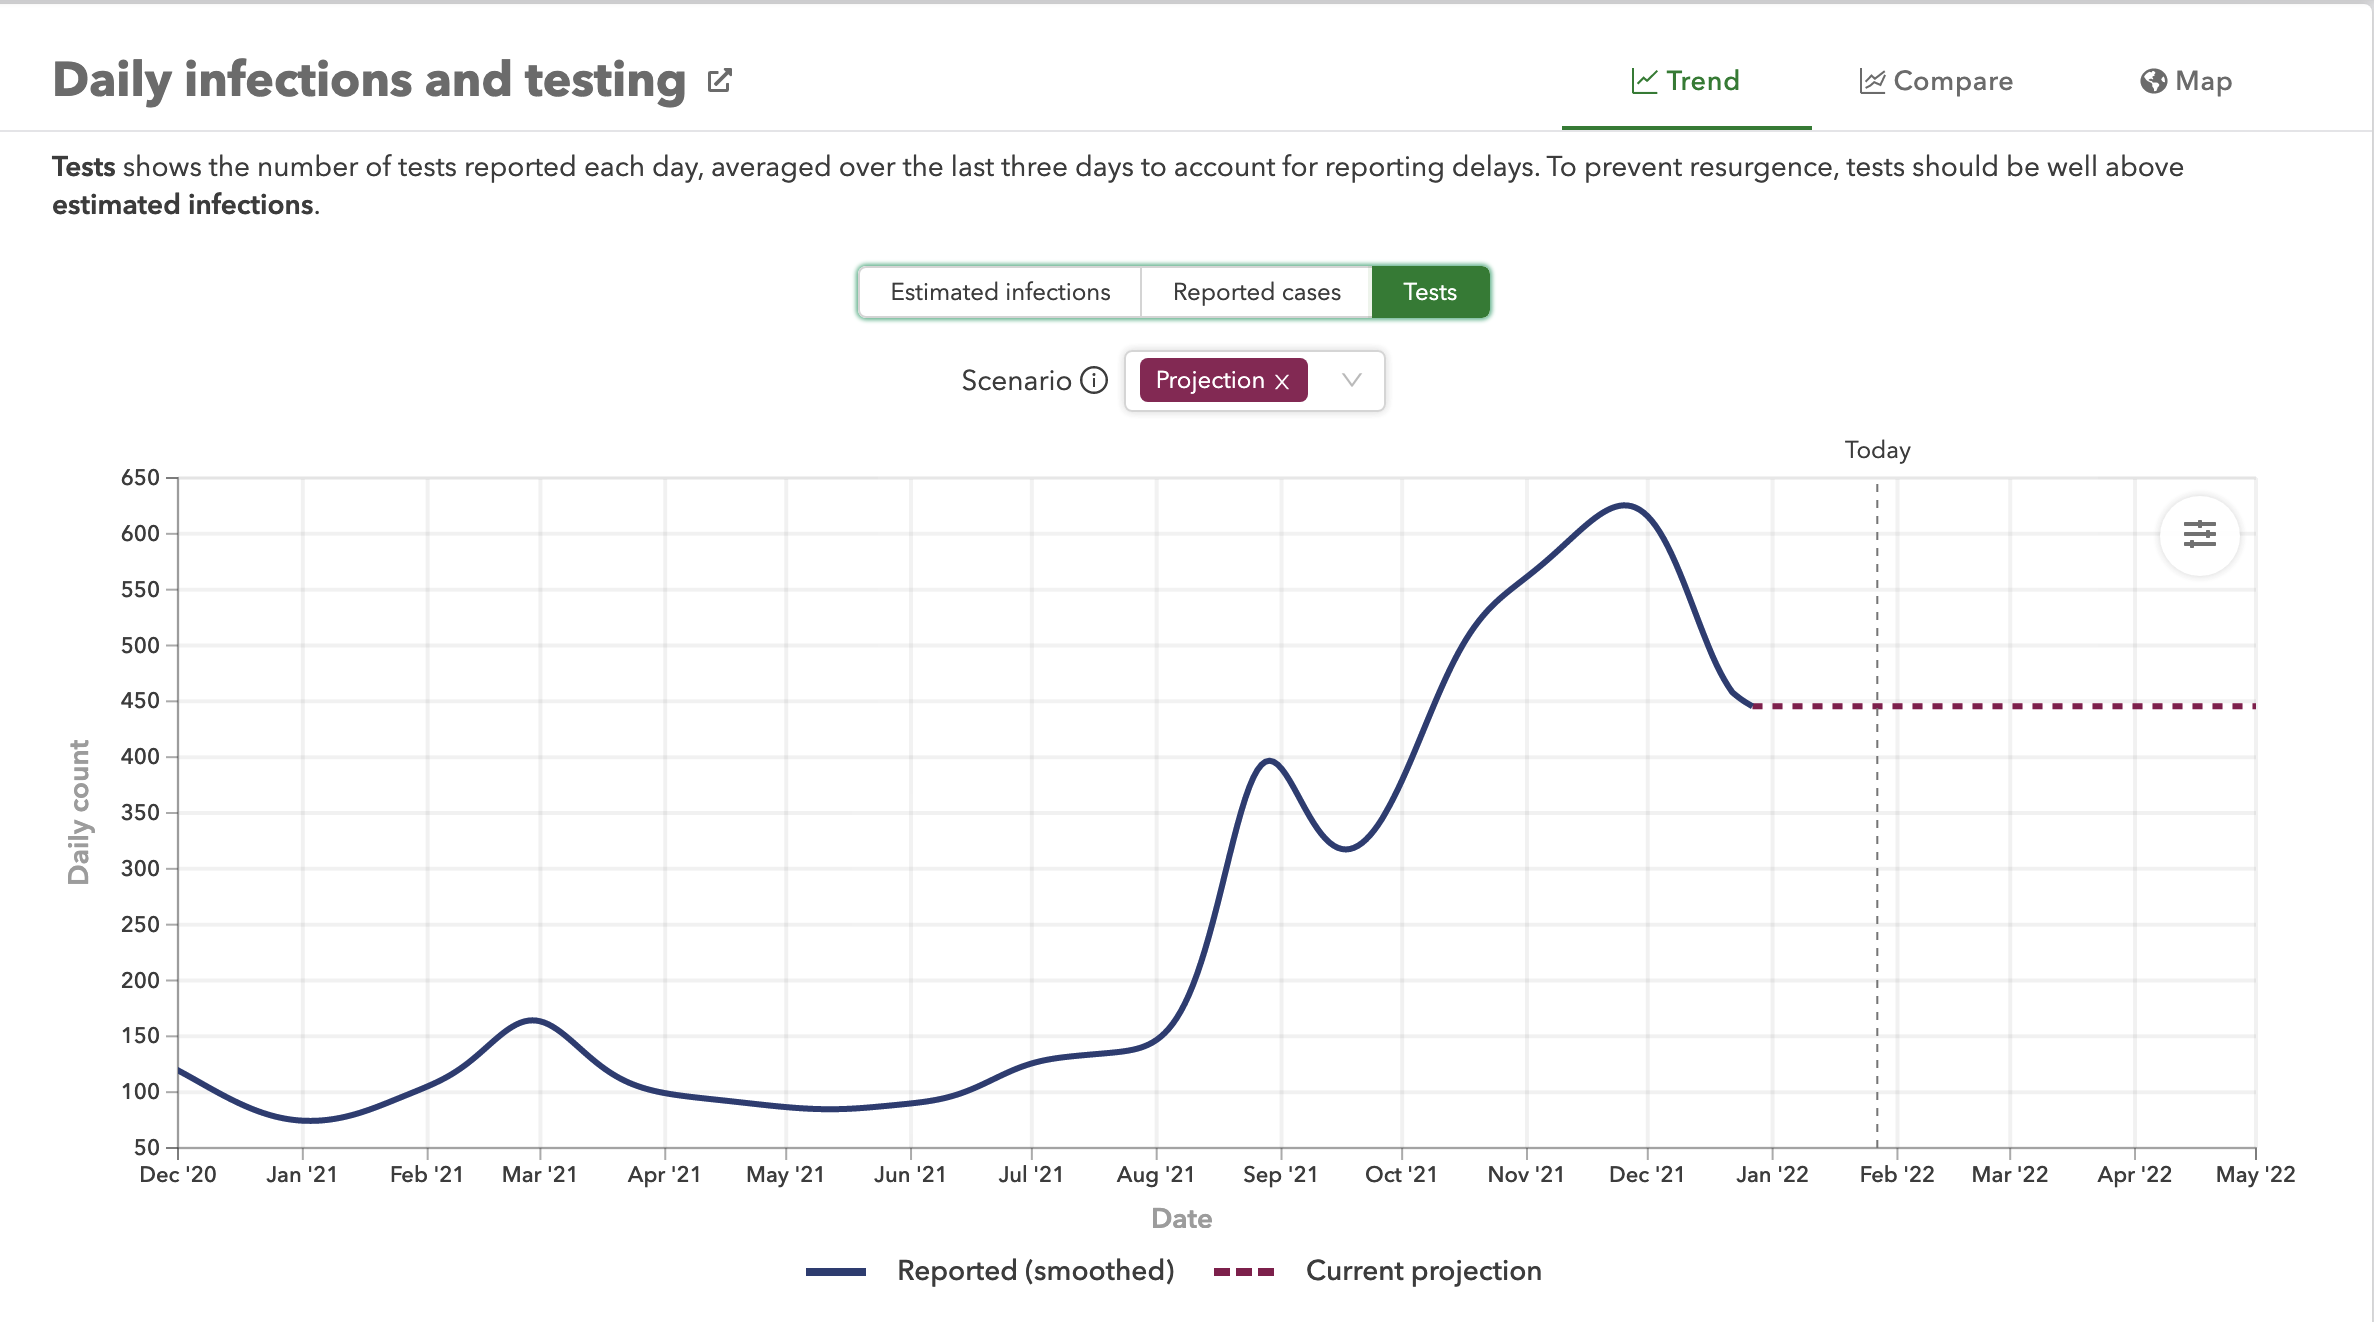
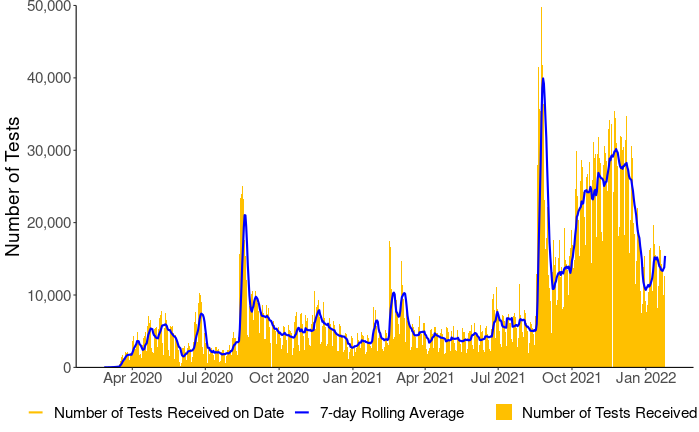
That’s clearly wrong in two ways: first, it’s not going to be steady like that. More importantly, it’s too low by about a factor of 50. Here’s what the Ministry of Health says daily testing data looks like
The vaccination model is also somewhat out of data
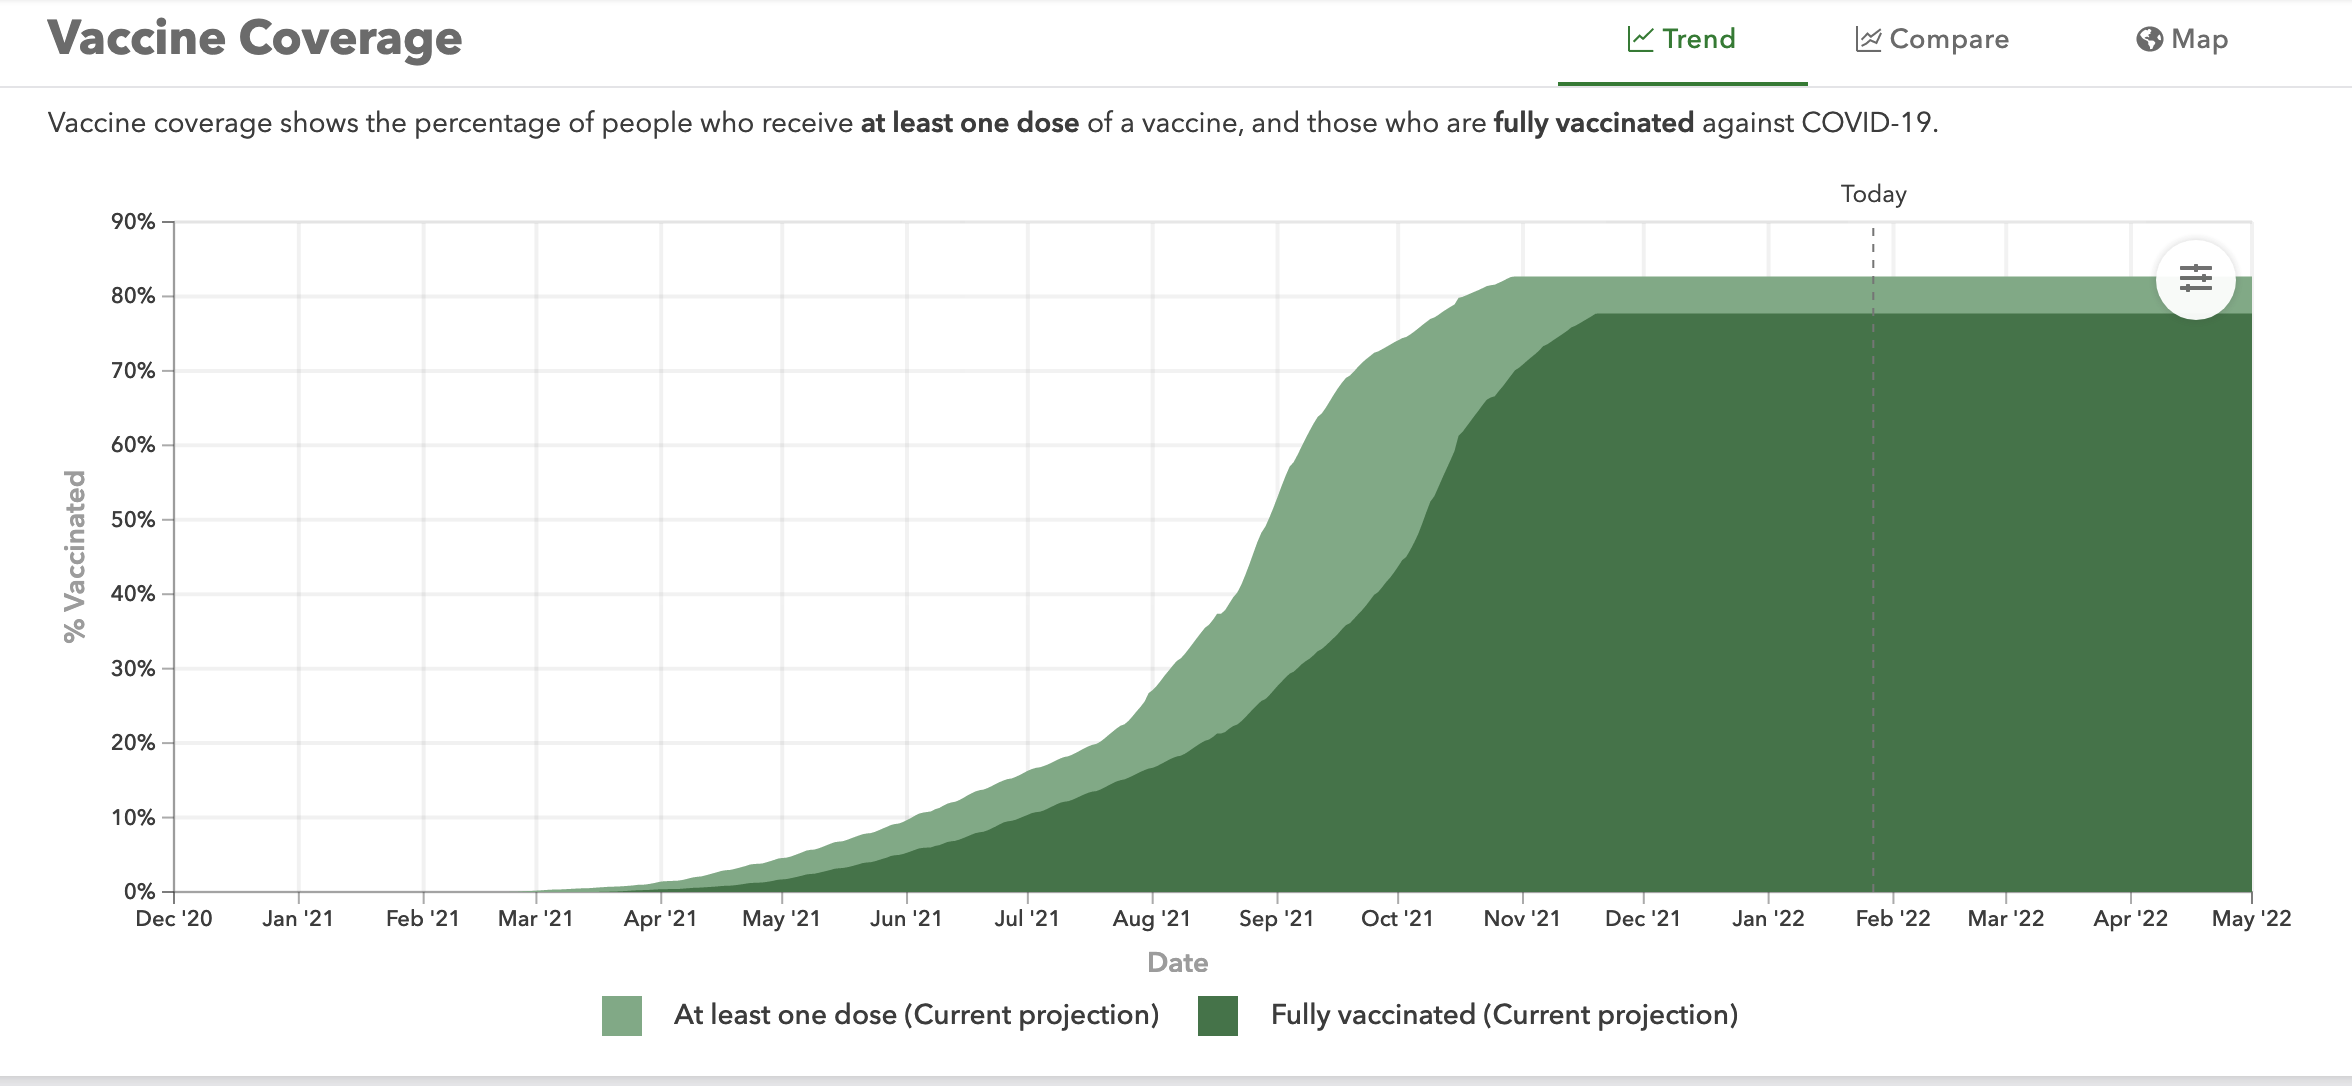
It projects vaccinations as stopping in mid-November. They didn’t.
What can we say about the projections? Well, Victoria, with a slightly higher population, somewhat weaker restrictions, and not wildly different vaccination rate peaked at about 14,000 cases per day. So that’s clearly in the plausible range, and would be bad enough. It’s not out of the question that things get as bad as the IHME estimate, but I think it’s unrealistic to think of it as a most likely projection. And it certainly doesn’t need the confusion of ‘infections’ and ‘cases’.
Thomas Lumley (@tslumley) is Professor of Biostatistics at the University of Auckland. His research interests include semiparametric models, survey sampling, statistical computing, foundations of statistics, and whatever methodological problems his medical collaborators come up with. He also blogs at Biased and Inefficient See all posts by Thomas Lumley »
The original modelling back around April 2020
for NZ had the very worst death numbers projected at 80,000 ( and widely reported) and the very best result was 20 deaths . ( not reported) Thats around what we got.
Now its infections as the mortality rate is upended.
2 years ago
Thanks very much – this is very good for the non-experts out here.
2 years ago
Just goes to show there are two ends to every confidence interval and it’s the high end that provides the clickbait.
2 years ago
Well, up to a point. But there wasn’t a confidence interval here
2 years ago