January 18, 2022
Briefly
- Covid was the leading cause of death “in the line of duty” for US law enforcement officers. (Also, the report giving the numbers had this graph
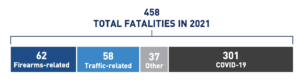
The ‘Covid-19’ section of the bar, which should be nearly two-thirds of the total, is less than half) - An attempt to check up on a sample of India’s forest-planting program
- Story on vaping from the Herald: it appears an Asthma and Respiratory Foundation survey gets very different results from the NZ Health Survey on the proportion of teens who vape daily. That’s pretty concerning: 5.8% vape daily vs 20% ‘addicted’ means at least one of the surveys is badly wrong.
- People are more likely to trust pretty graphics (separately from other reasons to trust the information)
- Overestimating ‘incidental’ Covid diagnoses in London hospitals

Thomas Lumley (@tslumley) is Professor of Biostatistics at the University of Auckland. His research interests include semiparametric models, survey sampling, statistical computing, foundations of statistics, and whatever methodological problems his medical collaborators come up with. He also blogs at Biased and Inefficient See all posts by Thomas Lumley »
Regarding the US Police fatalities, my guess would be that the proportions are based on the space needed for the word “Firearms-Related”, which dictated the size of the first box. The next boxes were vaguely related to the first and what was left over was given to Covid. Of course they could have made the whole graphic wider, or reduced the font size (which amount to the same thing) but the editor may have said ‘you have this much space, and make it readable’. The road to hell is paved with poor graphics.
2 years ago
https://www.asthmafoundation.org.nz/assets/images/A-2021-report-into-youth-vaping.pdf is the Asthma Foundation’s report. The survey was of 19 thousand students and was voluntary and anonymous. In the flow chart on page 16 2921 replies were “excluded due to data from
one school exceeding total school roll”.
2 years ago
–very dubious expression–
2 years ago
Both could be true-ish. Kids are more constrained by income and access so they can be addicted but not vape every day.
Is it beauty or perception of effort? Is a nice looking graph more believable because someone has put the time into making it look nice so there is an assumption they have put time into getting the data right.
2 years ago
The 20% figure in the ARFNZ report is daily vapers as far as I can tell (reporting vaping once or more per day).
It does look like the participant profile wasn’t that representative of the target population (e.g. 42% of respondents from top two deciles of schools; and only 9% Maori and 5% Pacific, which should be about 25% and 9% respectively according to 2020 figures from Ministry of Education).
I couldn’t see any mention of e.g. post-stratification weighting to correct for this (almost definitely better than ignoring this aspect?) or the achieved response rates (other than a qualitative statement that response rates were low in the majority of schools)
For the NZHS I’d suspect NZHS would underestimate prevalence of these behaviours in teens, given the survey is conducted at home (even if completed privately).
2 years ago