Posts tagged Winner (58)

March 12, 2012

Stat of the Week Winner: March 3-9 2012

This week’s winner was tough to decide – there were a fantastic selection of nominations. Thank you to all who entered!

The winner is Eric Crampton’s nomination of the Dominion Post’s burglary statistics:

“Wellingtonians were far less likely to be burgled than their Auckland counterparts, with 31 per cent of all burglaries taking place in the Auckland region, compared with just under 9 per cent in Wellington.”

Eric points to Bill Kaye-Blake’s thorough critique here.

March 5, 2012

Stat of the Summer Competition Winner!

Thank you for all the fantastic Stat of the Summer nominations.

Two of them generated popular posts on Stats Chat:

The winner was chosen to be Eric Crampton’s nomination of smoker costs from The Quit Group, quoted on Radio NZ for smokers each costing the economy $139,000/year.

If it were true, the sky would fall in.

While the original source provided a form of correction to Eric for the smoking number, as far as we know Radio NZ didn’t correct the report.

Congratulations Eric for winning a copy of Tufte’s book “Beautiful Evidence”.

Thank you to everyone who took part and we are now resuming our weekly competition, so please keep your nominations coming in!

December 19, 2011

Stat of the Week Winner: December 10-16 2011

Thanks to Sammy and Steve for their nominations last week.

Sammy highlights a very common misconception – except that those who think it are not going to be loyal viewers of StatsChat!

Steve’s graph does suppress zero, but the data is there to think about, and the number of injuries reported has – for whatever reason – almost doubled in 5 years.

Congratulations to Sammy for being this week’s Stat of the Week winner!

December 12, 2011

Stat of the Week Winner: December 3-9 2011

Congratulations to David Welch for his nomination winning our Stat of the Week award!

He nominated a front page story on the NZ Herald:

Almost half of Kiwis working overseas make more than $100,000 a year – and they are split on whether they want to come home. A quarter say they have no wish to return to New Zealand to live, but 27 per cent are looking for work here.

David commented:

A classic case of a non-representative sample — the real statistic here is that half of 15000 Kea members who chose to respond to an online survey earn over 100k. Throughout the article, the proper “respondents” is replaced with “kiwis”. But then it wouldn’t be news-worthy…

While the headline and introductory comments use “Kiwis” (and the point about a non-representative sample is not addressed in the article) the rest of the article may now have been updated to indicate it was only for survey respondents. We note also that original press release from Kea is careful with its wording, using “respondents” and “overseas-based Kiwis in the survey”.

December 5, 2011

Stat of the Week Winner: November 26 – December 2 2011

Thanks for the two nominations for last week’s Stat of the Week competition.

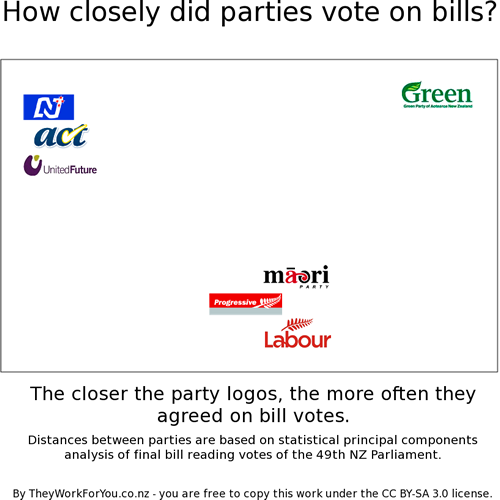
Both were about They Work For You‘s statistical analysis of how the various political parties voted during the last government with a summary graphic:

As both nominations were to the same story, (and it’s quite interesting), we have decided to award it jointly.

It would have been interesting to see a more subtle analysis interpreting the type of bill (and their sign in the PCA) driving the two principal components.

It is not very interesting that Labour and Progressive vote together, but what is separating them from the Greens and from National?

November 14, 2011

Stat of the Week Winner: November 5-11 2011

Thanks for to those who nominated something for last week’s Stat of the Week competition, however no winner is being awarded this week.

We would like to pay special tribute to Stephen Cope’s excellent graphic on the Rena – not only because it improved a terrible one in the NZ Herald but because his was so clear. Thanks Stephen!

If you see a poor graphic in the media and have suggestions for how it can be improved, please let us know!

November 7, 2011

Stat of the Week Winner: October 29-November 4 2011

Thanks for all the nominations for last week’s Stat of the Week competition.

We’ve awarded Cam Slater’s nomination as the winner, with runner up going to John Kerr’s nomination.

October 31, 2011

Stat of the Week Winner: October 22-28 2011

Thanks to Adina for the nomination but due to a lack of other entries, there is no winner for this week.

October 24, 2011

Stat of the Week Winner: October 15-21 2011

Thanks to Rob for his nomination of a misleading graph but due to a lack of other entries (perhaps we were all a little distracted by other events this week), there is no winner for this week.

October 17, 2011

Stat of the Week Winner: October 8-14 2011

Thanks for all the nominations this week. We’ve selected Eric Crampton’s nomination of a “mutant statistic” to be this week’s winner:

Here’s TVNZ’s quote: “Australia’s Cancer Council said the Senate should end the political delays and get on with passing the legislation, with authorities estimating smoking now kills 15,000 Australians each year and costs the health system $32 billion.”

The $32 billion figure comes from Collins & Lapsley’s report on the social costs of alcohol, tobacco, and other drugs.

Most importantly, $32 billion figure counts a host of tangible and intangible costs that fall on the smoker, those around the smoker, and the public health system. Only $312 million of the $32 billion, according to the report, counts as a net health cost. Just look at the first table at xii in the Executive Summary.

I get really really annoyed at how these big numbers, which mostly consist of costs borne by the smoker or drinker himself, get twisted by activists like the Cancer Council to build support for policies that further beat on smokers and drinkers. There can be a case for anti-smoking policy. But it oughtn’t be based on lies. Smokers pay more in tax than they cost the health system in any country that has a reasonably large tobacco tax and a reasonably large public pension system.

This is a classic example of using the wrong definition for a figure (we noted the table said $318.4 million rather than $318 million) – a common problem with statistics – and $32 billion is rather different from $318 million!