Posts from December 2011 (32)

December 14, 2011

We are the 0.01%?


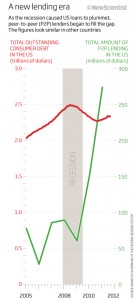
New Scientist has an interesting article on peer-to-peer lending, a crowd-sourced alternative to borrowing from banks.  Unfortunately, it’s illustrated by an extremely misleading graph.

The graph title says ” As the recession caused US loans to plummet, peer-to-peer lenders began to fill the gap”, and the graph certainly makes the rise in peer-to-peer lending (green) look dramatic compared to total US consumer debt (red). However, the axis scale for the green line is 10,000 times smaller than for the red line. The point where the red and green lines cross is where peer-to-peer first reached 0.01% of all consumer lending.

If the two lines used the same y-axis scale, the green line would be horizontal and indistinguishable from the zero line.  Perhaps peer-to-peer lenders “began” to fill the gap, but they will have to expand a thousand fold before they are even visible on the same scale as total US consumer debt.


December 13, 2011

Below the margin of error

“a policy which recognises that individuals are the owners of their own lives, and which probably has the potential to win broad support at a time when they’re polling below the margin of error” – NZ Classic Liberal

“Radio Rhema, Inferno, Solid Gold, Radio Live, Sunday News,  and Herald On Sunday all rate below the margin of error” – Greater Queenstown/Arrowtown Media Survey

“Whether our party does well, or remains mired below the margin of error, there is little doubt that libertarian ideas are slowly diffusing into the public consciousness.” – Sean Fitzpatrick, Libertarianz

“Given that ACT was last polling below the margin of error, their opinions, flattering or otherwise, hardly seem likely to sway the result.” – The Northland Age.

“Look at Huntsman running below 2 percent. He is running below the margin of error. That’s how bad he’s doing. He may actually have zero or owe somebody votes.” – Dean Obeidallah

Dean Obeidallah is a professional comedian, and he knows it’s a joke.  The others seem to be serious, though they may just mean “very small” rather than anything more precise.

Careful pollers refer to the uncertainty margin they routinely quote as the “maximum margin of error”.  Unfortunately the first word gets left off by most people who quote the results.   The maximum margin of error in a poll is the margin of error in an estimate of 50%.   That’s fine for the major parties, but if you want to know how many people support Winston Peters, or how many believe they have been abducted by aliens, you need a different formula.
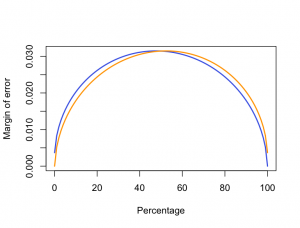
Since proportions can’t be negative, and since any non-zero percentage in a poll implies a non-zero percentage in the population, the uncertainty must be smaller for percentages near zero or one hundred.  The uncertainty range must also be asymmetric: a 1% result can’t overestimate the truth by more than 1%, but it could underestimate the truth by more than 1%.

The graph shows the upper (blue) and lower (orange) margins of error for percentages from 0 to 100% in a poll of 1000 people, the size that Colmar Brunton typically uses.  Over the range from about 20% to 80% the curve is pretty flat, and using the maximum margin of error is a good approximation.  For values less than 10% or more than 90% we need a better rule of thumb.

Some rough approximations that might be useful:

  • At 10%, the margin of error is about two-thirds of the maximum
  • At 5%, the crucial MMP threshold, the margin of error is about half the maximum
  • For percentages greater than zero but less than the maximum margin of error, the relative margin of error is roughly 50%
  • If the percentage is zero there isn’t any margin of error downwards, but the upper margin of error is 3 divided by the sample size (eg 3/1000=0.3% for a sample of 1000).

The first two of these rules of thumb come from the formula for the variance  of a proportion p, which is p(1-p)/n for a sample size of n. The maximum margin of error is the square root of 1/n, so we can work out n easily.

The last rule is the famous rule of three: if you see none of something, the upper bound for the proportion is the same as the estimate if you had seen three of them.

The third rule is a rough approximation based on looking at some numbers, and is less accurate than the others.
December 12, 2011

Stat of the Week Winner: December 3-9 2011

Congratulations to David Welch for his nomination winning our Stat of the Week award!

He nominated a front page story on the NZ Herald:

Almost half of Kiwis working overseas make more than $100,000 a year – and they are split on whether they want to come home. A quarter say they have no wish to return to New Zealand to live, but 27 per cent are looking for work here.

David commented:

A classic case of a non-representative sample — the real statistic here is that half of 15000 Kea members who chose to respond to an online survey earn over 100k. Throughout the article, the proper “respondents” is replaced with “kiwis”. But then it wouldn’t be news-worthy…

While the headline and introductory comments use “Kiwis” (and the point about a non-representative sample is not addressed in the article) the rest of the article may now have been updated to indicate it was only for survey respondents. We note also that original press release from Kea is careful with its wording, using “respondents” and “overseas-based Kiwis in the survey”.

Stat of the Week Competition: December 10-16 2011

Each week, we would like to invite readers of Stats Chat to submit nominations for our Stat of the Week competition and be in with the chance to win an iTunes voucher.

Here’s how it works:

  • Anyone may add a comment on this post to nominate their Stat of the Week candidate before midday Friday December 16 2011.
  • Statistics can be bad, exemplary or fascinating.
  • The statistic must be in the NZ media during the period of December 10-16 2011 inclusive.
  • Quote the statistic, when and where it was published and tell us why it should be our Stat of the Week.

Next Monday at midday we’ll announce the winner of this week’s Stat of the Week competition, and start a new one.

The fine print:

  • Judging will be conducted by the blog moderator in liaison with staff at the Department of Statistics, The University of Auckland.
  • The judges’ decision will be final.
  • The judges can decide not to award a prize if they do not believe a suitable statistic has been posted in the preceeding week.
  • Only the first nomination of any individual example of a statistic used in the NZ media will qualify for the competition.
  • Employees (other than student employees) of the Statistics department at the University of Auckland are not eligible to win.
  • The person posting the winning entry will receive a $20 iTunes voucher.
  • The blog moderator will contact the winner via their notified email address and advise the details of the $20 iTunes voucher to that same email address.
  • The competition will commence Monday 8 August 2011 and continue until cancellation is notified on the blog.

Stat of the Week Nominations: December 10-16 2011

If you’d like to comment on or debate any of this week’s Stat of the Week nominations, please do so below!

December 11, 2011

Need to prove something you already believe?

Statistics are easy: All you need are two graphs and a leading question:

More correlation versus causation examples at Business Week.

December 6, 2011

The Magic of Numbers

Here’s the final poster we sent out to schools around the country this week:The Magic of numbers:

The other posters sent out may be found here and here.

December 5, 2011

Stat of the Week Winner: November 26 – December 2 2011

Thanks for the two nominations for last week’s Stat of the Week competition.

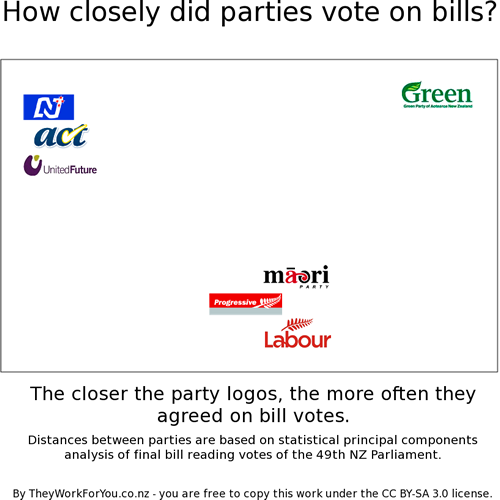
Both were about They Work For You‘s statistical analysis of how the various political parties voted during the last government with a summary graphic:

As both nominations were to the same story, (and it’s quite interesting), we have decided to award it jointly.

It would have been interesting to see a more subtle analysis interpreting the type of bill (and their sign in the PCA) driving the two principal components.

It is not very interesting that Labour and Progressive vote together, but what is separating them from the Greens and from National?

Stat of the Week Competition: December 3-9 2011

Each week, we would like to invite readers of Stats Chat to submit nominations for our Stat of the Week competition and be in with the chance to win an iTunes voucher.

Here’s how it works:

  • Anyone may add a comment on this post to nominate their Stat of the Week candidate before midday Friday December 9 2011.
  • Statistics can be bad, exemplary or fascinating.
  • The statistic must be in the NZ media during the period of December 3-9 2011 inclusive.
  • Quote the statistic, when and where it was published and tell us why it should be our Stat of the Week.

Next Monday at midday we’ll announce the winner of this week’s Stat of the Week competition, and start a new one.

The fine print:

  • Judging will be conducted by the blog moderator in liaison with staff at the Department of Statistics, The University of Auckland.
  • The judges’ decision will be final.
  • The judges can decide not to award a prize if they do not believe a suitable statistic has been posted in the preceeding week.
  • Only the first nomination of any individual example of a statistic used in the NZ media will qualify for the competition.
  • Employees (other than student employees) of the Statistics department at the University of Auckland are not eligible to win.
  • The person posting the winning entry will receive a $20 iTunes voucher.
  • The blog moderator will contact the winner via their notified email address and advise the details of the $20 iTunes voucher to that same email address.
  • The competition will commence Monday 8 August 2011 and continue until cancellation is notified on the blog.

Making my mark on the world with statistics

As a follow-up to my earlier post about the posters we sent out to schools, it may also be of interest to read more of our students’ stories about where they’ve ended up and how they use statistics.

Read stories such as Sammie Jia‘s:

“I’m a biometrician; I analyse data for the plant and food scientists at the New Zealand Institute for Plant and Food Research. This involves designing statistical experiments for research, analysing and interpreting the data, summarising the results and making suggestions to the scientists based on my findings.

“At the moment I am working with the scientists investigating how the kiwifruit disease Psa spreads in vines. I’m also looking at how a test group of consumers liked a new type of kiwifruit – modelling human behaviour is fun! I know my work makes a contribution to New Zealand horticulture, and that feels good.

Read more »