Posts from June 2012 (33)

June 8, 2012

Beer even better than chocolate?

Q:  Isn’t Friday, after the morning rush, a great time to publish a story about benefits of beer?

A:  Yes, the Herald did much better than Medical Daily or Cell Metabolism on that front.

Q: Did the researchers study beer effects in humans, or was it another mouse study?

A: It was a mouse study, but no beer was harmed during the research. The mice were fed nicotinamide riboside directly.

Q: What’s this nicotinawhatsit beer vitamin?

A: It’s related to the real vitamin niacin (B3), and the body can turn it into the same thing, called NADH or NAD+

Q: And?

A: In mice, at least, it’s good for cholesterol and also has effects on some molecules thought to be related to aging.

Q: Wasn’t that supposed to be red wine, not beer?

A: Yes, resveratrol in red wine was also supposed to affect the same molecules.  There has been some controversy about the research, though.

Q: How much beer would you need to drink to get enough nicotinawhatsit?

A: The research paper doesn’t mention beer at all, nor does the video interview linked at Medical Daily.  The researcher just say the compound is found in “milk and some other foods”.

Q: So where does the beer come from?

A: Well, it makes a good story.  And brewer’s yeast, like all organisms, does produce some of the compound, so it could be in beer.  There’s also a patent for using mutant yeast to make it. And there’s no evidence that it isn’t found in beer.


NRL Predictions, Round 14

Team Ratings for Round 14

Here are the team ratings prior to Round 14, along with the ratings at the start of the season. I have created a brief description of the method I use for predicting rugby games. Go to my Department home page to see this.

Current Rating Rating at Season Start Difference
Storm 12.17 4.63 7.50
Broncos 5.71 5.57 0.10
Wests Tigers 4.47 4.52 -0.00
Bulldogs 3.70 -1.86 5.60
Sea Eagles 2.70 9.83 -7.10
Cowboys 1.58 -1.32 2.90
Warriors 1.51 5.28 -3.80
Rabbitohs 1.00 0.04 1.00
Dragons -1.20 4.36 -5.60
Sharks -2.41 -7.97 5.60
Titans -3.13 -11.80 8.70
Roosters -3.76 0.25 -4.00
Knights -4.18 0.77 -5.00
Panthers -4.58 -3.40 -1.20
Eels -7.79 -4.23 -3.60
Raiders -9.53 -8.40 -1.10


Performance So Far

So far there have been 98 matches played, 58 of which were correctly predicted, a success rate of 59.18%.

Here are the predictions for last week’s games.

Game Date Score Prediction Correct
1 Titans vs. Cowboys Jun 01 28 – 12 -3.30 FALSE
2 Sea Eagles vs. Dragons Jun 01 20 – 8 7.72 TRUE
3 Raiders vs. Wests Tigers Jun 02 0 – 40 -3.69 TRUE
4 Bulldogs vs. Rabbitohs Jun 02 23 – 18 7.62 TRUE
5 Warriors vs. Storm Jun 03 12 – 22 -5.42 TRUE
6 Broncos vs. Knights Jun 03 50 – 24 12.18 TRUE
7 Eels vs. Sharks Jun 04 29 – 20 -2.76 FALSE


Predictions for Round 14

Here are the predictions for Round 14

Game Date Winner Prediction
1 Storm vs. Wests Tigers Jun 08 Storm 12.20
2 Knights vs. Raiders Jun 09 Knights 9.90
3 Sharks vs. Titans Jun 10 Sharks 5.20
4 Roosters vs. Broncos Jun 10 Broncos -5.00
5 Panthers vs. Warriors Jun 11 Warriors -1.60


Fractional companies or fractional women?

We have a Stat of the Week submission, for the NZ Herald’s claim that

Of Australia’s top 200 listed companies, 12.7 per cent had female directors by the beginning of August, compared to 9.3 per cent for the top 100 listed companies here.

That is, 25.4 of the Australian companies and 9.3 of the NZ companies have female directors.  Perhaps the 0.3 is either only partly a company or partly female.

Or perhaps, since the story mentions earlier that about 9% of all private-sector directors are female, you might guess that 9.3% is the proportion of females among all directors of the NZ 100.  That implies the proportion of companies with at least one female director is almost certainly higher than 9%.

A little Googling confirms this: 43% of the NZ 100 companies (that’s 43 companies, for those of you playing along at home) have at least one female director. 13% have more than one.

June 7, 2012

In real terms

Auckland’s housing prices just hit a new record, says Stuff.  The average (?median, ?mean) price in May according to Barfoot & Thompson was $582285, higher than their reported 2007 peak of $538000. But the dollars are smaller than they were back in 2007.

If you bought a house for $538000 in 2007 dollars and sold it for $582285 in 2012 dollars, you would have made a loss of about $25000 2007 dollars before legal and bank costs.  And with 20% deposit and 6% interest, you’d be paying more than $2500 each month for the privilege (and nearly $4000 for the first couple of years, when interest rates were up at 10%)


Qualitative vs quantitative

The Herald claims “NZ says no to larger schoolrooms”  based on a street survey of “more than 70” people, of whom 81% were opposed to the changes.   The current clicky poll has 74% of about 8000 responses supporting the much weaker claim ‘Less one-on-one time can’t be good for kids’,  a statement that even John Key would probably not contest. We aren’t told what the actual questions were in the street survey, or how much the respondents knew about what the actual proposed changes were.

There are two ways you can get useful data by interviewing people.  In quantitative research, where you take a proper probability sample and ask questions with simple answers unambiguously related to what you are trying to find out.  The law of large numbers then ensures that your sample results are not too different from the population results.   The Colmar Brunton polls are an example of this. In qualitative research, you are trying to find out the full range of responses and understand people’s thinking: you get smaller numbers of people and ask much more open-ended questions.  Marketing focus groups are an example of this approach.

Just as the clicky website polls are a degraded version of quantitative survey research, the street poll is a degraded form of qualitative survey research.  A good qualitative survey would try to find out how people feel about the tradeoffs in education funding, about where they would rather make cuts, and how views differed between groups of people — do people without children give similar explanations to  those with children, for example.

In this case, however, public opinion is probably clear enough that any measurement will give a similar result, at least as long as you’re not interested in working out what policies would be better.

June 6, 2012

Equal pay statistics

As we know, women are paid less than men, and it’s not primarily because of sick-leave differences.   So what does cause it?  Motivated by current US legislation, the Washington Post digs out a 2007 research report that estimates how much of the difference can be statistically explained by factors such as choice of occupation and leaving the workforce to take care of children.

In a sense, this attempts to give a lower bound on the impact of discrimination —  some of the impact of childcare responsibilities is a hangover from traditional roles, but it’s quite possible that in a perfect world there would still be some gender differences in child care.  Similarly, some of the lower pay in majority-female occupations is probably because these occupations had more women, but it’s hard to say how much of it.

The reseachers, Francine Blau and Lawrence Kahn, looked at US data from 1979, 1989, and 1998 (the report was being prepared and revised for a long time). In 1979 the pay ratio was 63%, but comparing men and women with the same education and experience it was 71%, and additionally controlling for occupation, industry, and union coverage it was 82%.  In 1998 the numbers were 80%, 81%, and 91%.

So, by 1998 about 10% of the US pay difference between men and women was explainable by differences in education and experience, about half of it was explainable by working in different industries or occupations, and the rest was not explainable by anything they measured.    I don’t know if anyone has done a similar analysis for New Zealand, where the differential is quite a bit smaller than in the US.

This is an example of the sort of thing you can only do with good-quality survey data; in this case from the University of Michigan’s Panel Study of Income Dynamics.

June 5, 2012

Think of a number, then multiply by five

You will have seen the controversy about the number of jobs in the new Sky City convention center.  I don’t have anything to add on the number of employees after it is built, but it’s interesting to see how construction jobs seem to be defined

The company’s report says 150 construction jobs could be created each year over a five-year period, making a total of 750, but they would be filled by people already employed on other projects. (3 News)

The original Horwath report said 150 jobs could be created over a five-year construction period for a total of 750.(Herald)

That is, if you have a five-year construction project that at a typical moment employs 150 people, this creates 750 jobs.  If you have a factory, or an office, or a convention center that employs 150 people at any time you would usually say it created 150 jobs — even that wouldn’t actually be true, since it mostly relocates jobs rather than creating them, but at least it’s fairly clear what is meant.

We should clearly hope that the convention center takes more than five years: the longer the construction period, the more jobs are created.

Why European Union is hard (part II)

One of the difficulties with surveys on sensitive questions is that people may respond just out of emotional affiliation or based on slogans, rather than actually reflecting carefully on their beliefs.   That’s the positive interpretation of opinion poll results collected in February by a Greek public opinion firm, who appear to be respectable apart from their horrible taste in graphs (via, and)

Among the questions was a section where respondents were asked whether they Strongly Disagree, Disagree, Agree, or Strongly Agree with statements (presumably in Greek and translated in the report)

  • Greece should claim by any means from Germany war reparations/indemnities
  • Greece should claim by any means from Germany the payment of ‘war loans’ granted to the German Occupation Forces during the period 1941-1944
  • Germany, with its current policy, attempts to dominate Europe through its financial power
  • They have right all those who argue that Germany’s current policy aims at the establishment of a Fourth Reich.

It’s surprising that someone would ask these questions, but it’s even more surprising that the proportion agreeing was 91%, 87%, 81%, and 77% respectively, and mostly in the ‘Strongly Agree’ category.

Why European Union is hard (part I)

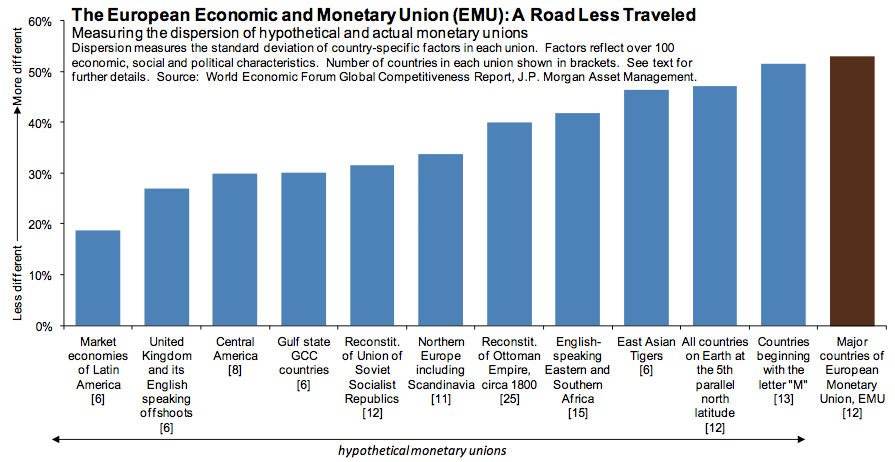
A graph originally from JP Morgan, and now around the web (via, and via) comparing the social, economic, and political heterogeneity of the Euro zone to various hypothetical monetary unions, some more plausible than others.  The Eurozone is more heterogenous than all of them.

June 4, 2012

Stat of the Week Competition: June 2-8 2012

Each week, we would like to invite readers of Stats Chat to submit nominations for our Stat of the Week competition and be in with the chance to win an iTunes voucher.

Here’s how it works:

  • Anyone may add a comment on this post to nominate their Stat of the Week candidate before midday Friday June 8 2012.
  • Statistics can be bad, exemplary or fascinating.
  • The statistic must be in the NZ media during the period of June 2-8 2012 inclusive.
  • Quote the statistic, when and where it was published and tell us why it should be our Stat of the Week.

Next Monday at midday we’ll announce the winner of this week’s Stat of the Week competition, and start a new one.
(more…)