Posts from August 2013 (54)

August 18, 2013

Killing people

TV3 has tried to stir up the issue of the death penalty in New Zealand.  They have a poll showing majority opposition by the country as a whole, and by supporters of every party except NZ First.  Even the Sensible Sentencing Trust isn’t in favor.

The lead-in to the story is that the murder rate has never ‘recovered’ from the abolition of the death penalty.  They have a graph showing homicides per capita rising and then falling again, but not to the earlier levels.

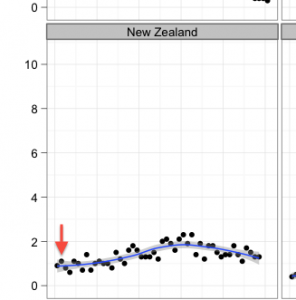
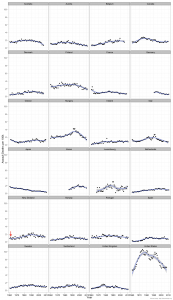
Using the term ‘recovered’ comes very close to asserting a causal connection; but is there even a reliable correlation? International comparisons are useful here.  I don’t have long time series for homicide, but Kieran Healy has produced a graph of international trends in deaths due to assault. This isn’t the same as homicide, but is close enough to be relevant.

Here’s the New Zealand panel, with the arrow indicating the abolition of the death penalty. The details are slightly different from those for homicide, but the basic trend is the same that TV3 reports.

nz


and here’s the international comparison, with NZ second from the bottom, on the left. As usual, click to embiggen

assault-deaths-oecd-ts-facet


The NZ pattern is very similar to other countries, including Australia (where abolition didn’t happen until about 10 years later), Finland (where it was abolished in 1949 for crimes committed in peacetime), and Switzerland (1942).

If you look at the countries that still have the death penalty, murder rates are low and falling in Japan, South Korea had the same sort of rise and fall that NZ has had (over a shorter time scale), and of course there’s the USA.

It doesn’t look as though the death penalty is a major driving force in these patterns.

August 17, 2013

How to lie with barcharts

From the Guardian, a story about a barchart in the Sun portraying the cost of ‘green energy’

SUN_GREEN_BARCHART_3007

False positives

From a number of fields

So when one particular paper began to strain the servers, attracting hundreds if not thousands of downloads, the entire editorial board began to pay attention. “What,” they asked, “is so special about this paper on the ryanodine receptor of Caenorhabditis elegans?” (For those of you who don’t know, Caenorhabditis elegans is a very common and much-loved model animal—it’s a small, soil-living roundworm with some very useful features. Please don’t ask me what a ryanodine receptor is; I don’t know and I don’t really care.)

  • Along similar lines, someone reminded me of the problem the UK town of Scunthorpe has with text filtering.  There is an old joke that there are two other football teams whose names contain swear words (punchline)
August 16, 2013

NRL Predictions, Round 23

Unfortunately these are a little late this week. I simply forgot to do them until just now.

Team Ratings for Round 23

Here are the team ratings prior to Round 23, along with the ratings at the start of the season. I have created a brief description of the method I use for predicting rugby games. Go to my Department home page to see this.

Current Rating Rating at Season Start Difference
Roosters 12.36 -5.68 18.00
Sea Eagles 9.78 4.78 5.00
Storm 9.64 9.73 -0.10
Rabbitohs 6.24 5.23 1.00
Bulldogs 4.30 7.33 -3.00
Knights 4.10 0.44 3.70
Cowboys 2.93 7.05 -4.10
Titans -0.89 -1.85 1.00
Sharks -1.04 -1.78 0.70
Warriors -1.18 -10.01 8.80
Broncos -3.79 -1.55 -2.20
Raiders -4.98 2.03 -7.00
Dragons -5.53 -0.33 -5.20
Panthers -8.35 -6.58 -1.80
Wests Tigers -11.19 -3.71 -7.50
Eels -16.13 -8.82 -7.30


Performance So Far

So far there have been 160 matches played, 97 of which were correctly predicted, a success rate of 60.62%.

Here are the predictions for last week’s games.

Game Date Score Prediction Correct
1 Storm vs. Rabbitohs Aug 09 26 – 8 5.37 TRUE
2 Eels vs. Wests Tigers Aug 09 26 – 22 -1.56 FALSE
3 Roosters vs. Raiders Aug 10 28 – 22 25.80 TRUE
4 Sharks vs. Knights Aug 10 14 – 18 0.21 FALSE
5 Sea Eagles vs. Warriors Aug 11 27 – 12 15.57 TRUE
6 Broncos vs. Dragons Aug 11 26 – 24 7.30 TRUE
7 Panthers vs. Cowboys Aug 11 4 – 36 -0.47 TRUE
8 Bulldogs vs. Titans Aug 12 16 – 26 14.61 FALSE


Predictions for Round 23

Here are the predictions for Round 23. The prediction is my estimated expected points difference with a positive margin being a win to the home team, and a negative margin a win to the away team.

Game Date Winner Prediction
1 Rabbitohs vs. Sea Eagles Aug 16 Rabbitohs 1.00
2 Broncos vs. Eels Aug 16 Broncos 16.80
3 Raiders vs. Bulldogs Aug 17 Bulldogs -4.80
4 Cowboys vs. Titans Aug 17 Cowboys 8.30
5 Dragons vs. Sharks Aug 17 Dragons 0.00
6 Warriors vs. Panthers Aug 18 Warriors 11.70
7 Knights vs. Storm Aug 18 Storm -1.00
8 Wests Tigers vs. Roosters Aug 19 Roosters -19.00


Diversity and groupthink

Nate Silver’s talk at the Joint Statistical Meetings a couple of weeks ago identified groupthink by insiders as a major threat to accurate journalism.  It’s natural to believe the opinions of other intelligent, well-informed people, but if they are working from  the same limited set of information as you, the fact that they agree with you is not actually good evidence that you’re right.

Tim Harford has a column this week arguing that diversity is important, for basically this reason. Even if, say, women or Maori or Asians or small-town farm boys aren’t actually better at decision-making, the simple fact that they have different starting points can lead to better decision-making by groups. It doesn’t have to, but it can. The New York Times also has a piece on this theme, by political scientist Scott Page.

An important empirical basis for the idea that diversity is, in itself, beneficial is the work of Solomon Asch on conformity.  Asch found that even in very simple decisions, many people would follow an obviously-wrong choice made by enough other people. On the other hand, even a single non-conforming voice, and even one that was more wrong than the consensus, could free people to follow the evidence of their own eyes.

Absolute and relative risks

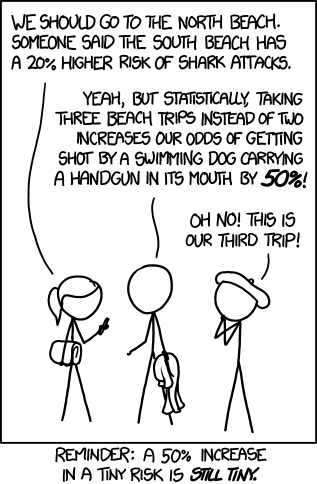
XKCD, reminding us of the difference

Collateral damage

There’s a long tradition in law and ethics of thinking about how much harm to the innocent should be permitted in judicial procedures, and at what cost. The decision involves both uncertainty, since any judicial process will make mistakes, and consideration of what the tradeoffs would be in the absence of uncertainty. An old example of the latter is the story of Abraham bargaining with God over how many righteous people there would have to be in the notorious city of Sodom to save it from destruction, from a starting point of 50 down to a final offer of 10.

With the proposed new child protection laws, though, the arguments have mostly been about the uncertainty.  The bills have not been released yet, but Paula Bennett says they will provide for protection orders keeping people away from children, to be imposed by judges not only on those convicted of child abuse but also ‘on the balance of probabilities’ for some people suspected of being a serious risk.

We’ve had two stat-of-the-week nominations for a blog post about this topic (arguably not ‘in the NZ media’, but we’ll leave that for the competition moderator). The question at issue is how many innocent people would end up under child protection orders if 80 orders were imposed each year.

The ‘balance of probabilities’ standard theoretically says that an order can be imposed (?must be imposed) if the probability of being a serious risk is more than 50%.  The probability could be much higher than 50% — for example, if you were asked to decide on the balance of probabilities which of your friends are male, you will usually also be certain beyond reasonable doubt for most of them.  On the other hand, there wouldn’t be any point to the legislation unless it is applied mostly to people for whom the evidence isn’t good enough even to attempt prosecution under current law, so the typical probabilities shouldn’t be that high.

Even if we knew the distribution of probabilities, we still don’t have enough information to know how many innocent people will be subject to orders. The probability threshold here is the personal partly-subjective uncertainty of the judge, so even if we had an exact probability we’d only know how many innocent people the judge thought would be affected, and there’s no guarantee that judges have well-calibrated subjective probabilities on this topic.

In fact, the judicial system usually rules out statistical prior information about how likely different broad groups of people are to be guilty, so the judge may well be using a probability distribution that is deliberately mis-calibrated.  In particular, the judicial system is (for very good but non-statistical reasons) very resistant to using as evidence the fact that someone has been charged, even though people who have been charged are statistically much more likely to be guilty than random members of the population.

At one extreme, if the police were always right when they suspected people, everyone who turned up in court with any significant evidence against them would be guilty.  Even if the evidence was only up to the balance of probabilities standard, it would then turn out that no innocent people would be subject to the orders. That’s the impression that Ms Bennett seems to be trying to give — that it’s just the rules of evidence, not any real doubt about guilt.  At the other extreme, if the police were just hauling in random people off the street, nearly everyone who looked guilty on the balance of probabilities might actually just be a victim of coincidence and circumstance.

So, there really isn’t an a priori mathematical answer to the question of how many innocent people will be affected, and there isn’t going to be a good way to estimate it afterwards either. It will be somewhere between 0% and 100% of the orders that are imposed, and reasonable people with different beliefs about the police and the courts can have different expectations.
August 15, 2013

Big Data on Radio NZ Nights

Dr Mark Apperley, from Uni of Waikato, with Phil O’Brien

“Big Data” isn’t just big, it’s unstructured.

(via Kate Hannah)

August 14, 2013

Different colours, one people?

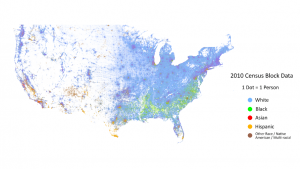
A beautiful map from the Cooper Center for Demographics at the University of Virginia, showing 300 million dots, one for each person in the United States, coloured by the census-reported race/ethnicity categories.

usmap


As we’ve pointed out before, the most obvious feature in the map is the change in population density across the north-south ‘dry line’, but it’s the other features that are of most interest. The larger black population across the south-east, and the greater diversity of the cities are obvious.

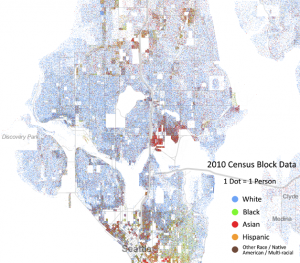
There’s also a zoomable version of the map for you to explore.  Here’s part of Seattle, where I used to live, which is the purple splotch at the top left of the whole-US map

seattle-map


At this smaller scale there’s a lot more clumping by race, with black and Hispanic people living at the top and bottom of the map. Oh, and that odd-shaped spot in the middle? That’s the University of Washington, so those are university students.

(via Luis Apiolaza on Twitter)

Currie Cup Predictions for Round 2

The first week of the Currie Cup proved difficult to predict. I did note that last year was very difficult to predict as well.

Team Ratings for Round 2

Here are the team ratings prior to Round 2, along with the ratings at the start of the season. I have created a brief description of the method I use for predicting rugby games. Go to my Department home page to see this.

Here are the team ratings prior to this week’s games, along with the ratings at the start of the season.

Current Rating Rating at Season Start Difference
Blue Bulls 11.05 0.87 10.20
Griquas 10.88 -6.38 17.30
Cheetahs 5.97 -3.10 9.10
Western Province -5.50 4.68 -10.20
Lions -10.59 -1.52 -9.10
Sharks -13.96 3.30 -17.30


Performance So Far

So far there have been 3 matches played, 0 of which were correctly predicted, a success rate of 0%.

Here are the predictions for last week’s games.

Game Date Score Prediction Correct
1 Sharks vs. Griquas Aug 09 30 – 32 17.20 FALSE
2 Lions vs. Cheetahs Aug 10 29 – 30 9.10 FALSE
3 Western Province vs. Blue Bulls Aug 10 24 – 24 11.30 FALSE


Predictions for Round 2

Here are the predictions for Round 2. The prediction is my estimated expected points difference with a positive margin being a win to the home team, and a negative margin a win to the away team.

Game Date Winner Prediction
1 Sharks vs. Lions Aug 16 Sharks 4.10
2 Blue Bulls vs. Griquas Aug 16 Blue Bulls 7.70
3 Western Province vs. Cheetahs Aug 17 Cheetahs -4.00