Bogus UK poll reporting
The Daily Express today: Ukip is now MORE popular than LABOUR: Nigel Farage gets polls boost as Ukip surges ahead. For NZ readers who aren’t familiar with Ukip, you can think of them as NZ First without all the tolerance and multiculturalism. It would be surprising, to put it mildly, for them to be doing that well.
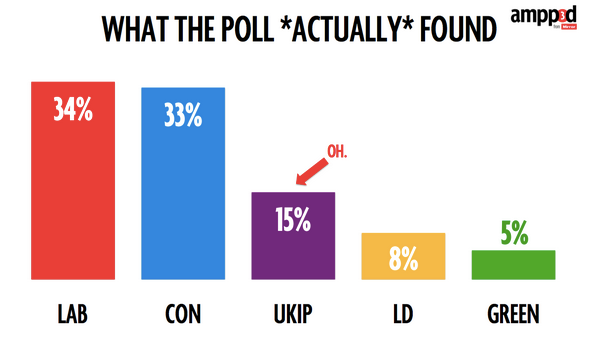
I heard about this on Twitter, from Federica Cocco, who (among other things) writes about politics, data, and statistics for the Mirror. Here are her graphs:
and
That’s a lot more plausible.
As she says, the problem is sampling bias. I had a long post drafted on reweighting and YouGov and non-response bias, but then I read her post more carefully (on a real computer, not on my phone) and realised the mistake was nothing nearly as complicated or subtle.
YouGov report results broken down in a lot of subsets, because that’s how their methodology works. Rather than attempting to get a relatively random sample and fine-tuning it to be representative, they have given up on random samples and rely on statistical modelling to get representative results. Essentially, they give each respondent a different number of ‘votes’ depending on whether people like them are under-represented or over represented in the sample.
For example, they report the results for people 18-24 (who were under-represented by about 1/3 in the sample and so will be given extra votes in the result), for Scots (who were over-represented by about 1/2 and so will be given fractional votes in the result), and for Sun readers (who were represented about right in the sample).
Overall, accounting for the over- and under-representation, the UKIP got 15% support; among the 18-24 year olds, the UKIP got 10% support; among the Scots, they got 2%. And among Sun readers they got 28% support. That’s pretty much the sort of variation you’d expect, and shows YouGov have probably picked sensible categories for doing their statistical adjustments.
The question still remains as to how the Express managed to report the poll results only for Sun readers, a small, unrepresentative sample of people who support their competition. I don’t know, but my guess is that it’s because the ‘Sun readers’ column is on the right-hand edge of the table of results. If you aren’t paying attention, you might expect the overall totals to be there.
[for non-UK readers: a guide to British papers]