Posts from April 2015 (35)

April 22, 2015

Super 15 Predictions for Round 11

Team Ratings for Round 11

The basic method is described on my Department home page.

Here are the team ratings prior to this week’s games, along with the ratings at the start of the season.

Current Rating Rating at Season Start Difference
Crusaders 7.84 10.42 -2.60
Waratahs 7.50 10.00 -2.50
Chiefs 5.25 2.23 3.00
Hurricanes 5.18 2.89 2.30
Stormers 3.64 1.68 2.00
Bulls 3.43 2.88 0.60
Brumbies 3.22 2.20 1.00
Highlanders 1.02 -2.54 3.60
Blues 0.15 1.44 -1.30
Sharks -0.50 3.91 -4.40
Lions -3.19 -3.39 0.20
Force -5.75 -4.67 -1.10
Rebels -6.02 -9.53 3.50
Cheetahs -6.71 -5.55 -1.20
Reds -8.08 -4.98 -3.10


Performance So Far

So far there have been 66 matches played, 41 of which were correctly predicted, a success rate of 62.1%.

Here are the predictions for last week’s games.

Game Date Score Prediction Correct
1 Crusaders vs. Chiefs Apr 17 9 – 26 9.50 FALSE
2 Hurricanes vs. Waratahs Apr 18 24 – 29 3.30 FALSE
3 Highlanders vs. Blues Apr 18 30 – 24 4.60 TRUE
4 Brumbies vs. Rebels Apr 18 8 – 13 15.60 FALSE
5 Force vs. Stormers Apr 18 6 – 13 -4.40 TRUE
6 Sharks vs. Bulls Apr 18 10 – 17 1.10 FALSE
7 Cheetahs vs. Reds Apr 18 17 – 18 6.90 FALSE


Predictions for Round 11

Here are the predictions for Round 11. The prediction is my estimated expected points difference with a positive margin being a win to the home team, and a negative margin a win to the away team.

Game Date Winner Prediction
1 Chiefs vs. Force Apr 24 Chiefs 15.50
2 Brumbies vs. Highlanders Apr 24 Brumbies 6.70
3 Crusaders vs. Blues Apr 25 Crusaders 11.70
4 Waratahs vs. Rebels Apr 25 Waratahs 17.50
5 Lions vs. Cheetahs Apr 25 Lions 7.50
6 Stormers vs. Bulls Apr 25 Stormers 4.20
7 Reds vs. Hurricanes Apr 26 Hurricanes -8.80


April 20, 2015

Stat of the Week Competition: April 18 – 24 2015

Each week, we would like to invite readers of Stats Chat to submit nominations for our Stat of the Week competition and be in with the chance to win an iTunes voucher.

Here’s how it works:

  • Anyone may add a comment on this post to nominate their Stat of the Week candidate before midday Friday April 24 2015.
  • Statistics can be bad, exemplary or fascinating.
  • The statistic must be in the NZ media during the period of April 18 – 24 2015 inclusive.
  • Quote the statistic, when and where it was published and tell us why it should be our Stat of the Week.

Next Monday at midday we’ll announce the winner of this week’s Stat of the Week competition, and start a new one.

(more…)

Stat of the Week Competition Discussion: April 18 – 24 2015

If you’d like to comment on or debate any of this week’s Stat of the Week nominations, please do so below!

April 15, 2015

Briefly

  • Good article in New York Times about why ‘survival rates’ aren’t the best way to assess progress in cancer. Same explanation that I’ve covered before several times: survival can improve when all you do is move diagnosis earlier without affecting disease or death at all
  • Whether state government subsidy of tuition in the US is increasing or decreasing seems like it should be an easy question. Not so much.
  • Comparing prices from different years without inflation adjustment is like comparing prices from different countries without currency conversion.  Any inflation adjustment is better than none, but if you’re interested in different ways it can be done there’s a fairly comprehensible review by the UK Statistics Authority
  • Headlines based on bogus polls are back. At Stuff, an implausible headline from a survey created to publicise a dating app and National Cheese Week. Celebrate National Library Week instead.

NRL Predictions for Round 7

Team Ratings for Round 7

The basic method is described on my Department home page.

Here are the team ratings prior to this week’s games, along with the ratings at the start of the season.

Current Rating Rating at Season Start Difference
Rabbitohs 9.55 13.06 -3.50
Roosters 8.65 9.09 -0.40
Cowboys 8.27 9.52 -1.30
Storm 4.98 4.36 0.60
Broncos 4.92 4.03 0.90
Panthers 3.02 3.69 -0.70
Warriors 1.24 3.07 -1.80
Dragons 0.06 -1.74 1.80
Bulldogs -0.19 0.21 -0.40
Knights -1.23 -0.28 -1.00
Sea Eagles -2.36 2.68 -5.00
Raiders -6.00 -7.09 1.10
Eels -7.29 -7.19 -0.10
Wests Tigers -7.31 -13.13 5.80
Sharks -7.35 -10.76 3.40
Titans -7.62 -8.20 0.60


Performance So Far

So far there have been 48 matches played, 25 of which were correctly predicted, a success rate of 52.1%.

Here are the predictions for last week’s games.

Game Date Score Prediction Correct
1 Broncos vs. Roosters Apr 10 22 – 18 -1.50 FALSE
2 Sharks vs. Knights Apr 10 22 – 6 -6.20 FALSE
3 Eels vs. Titans Apr 11 16 – 38 7.30 FALSE
4 Panthers vs. Sea Eagles Apr 11 22 – 12 8.10 TRUE
5 Warriors vs. Wests Tigers Apr 11 32 – 22 13.00 TRUE
6 Dragons vs. Bulldogs Apr 12 31 – 6 -0.20 FALSE
7 Raiders vs. Storm Apr 12 10 – 14 -8.70 TRUE
8 Rabbitohs vs. Cowboys Apr 13 12 – 30 7.80 FALSE


Predictions for Round 7

Here are the predictions for Round 7. The prediction is my estimated expected points difference with a positive margin being a win to the home team, and a negative margin a win to the away team.

Game Date Winner Prediction
1 Bulldogs vs. Sea Eagles Apr 17 Bulldogs 5.20
2 Dragons vs. Broncos Apr 17 Broncos -1.90
3 Cowboys vs. Warriors Apr 18 Cowboys 11.00
4 Storm vs. Roosters Apr 18 Roosters -0.70
5 Titans vs. Panthers Apr 18 Panthers -7.60
6 Knights vs. Eels Apr 19 Knights 9.10
7 Wests Tigers vs. Raiders Apr 19 Wests Tigers 1.70
8 Sharks vs. Rabbitohs Apr 20 Rabbitohs -13.90


Super 15 Predictions for Round 10

Team Ratings for Round 10

The basic method is described on my Department home page.

Here are the team ratings prior to this week’s games, along with the ratings at the start of the season.

Current Rating Rating at Season Start Difference
Crusaders 9.30 10.42 -1.10
Waratahs 6.96 10.00 -3.00
Hurricanes 5.72 2.89 2.80
Brumbies 4.40 2.20 2.20
Chiefs 3.79 2.23 1.60
Stormers 3.41 1.68 1.70
Bulls 2.89 2.88 0.00
Highlanders 0.90 -2.54 3.40
Blues 0.27 1.44 -1.20
Sharks 0.04 3.91 -3.90
Lions -3.19 -3.39 0.20
Force -5.51 -4.67 -0.80
Cheetahs -6.18 -5.55 -0.60
Rebels -7.20 -9.53 2.30
Reds -8.60 -4.98 -3.60


Performance So Far

So far there have been 59 matches played, 39 of which were correctly predicted, a success rate of 66.1%.

Here are the predictions for last week’s games.

Game Date Score Prediction Correct
1 Blues vs. Brumbies Apr 10 16 – 14 0.00 TRUE
2 Crusaders vs. Highlanders Apr 11 20 – 25 14.70 FALSE
3 Waratahs vs. Stormers Apr 11 18 – 32 10.80 FALSE
4 Force vs. Cheetahs Apr 11 15 – 24 7.10 FALSE
5 Bulls vs. Reds Apr 11 43 – 22 15.20 TRUE
6 Lions vs. Sharks Apr 11 23 – 21 0.50 TRUE


Predictions for Round 10

Here are the predictions for Round 10. The prediction is my estimated expected points difference with a positive margin being a win to the home team, and a negative margin a win to the away team.

Game Date Winner Prediction
1 Crusaders vs. Chiefs Apr 17 Crusaders 9.50
2 Hurricanes vs. Waratahs Apr 18 Hurricanes 3.30
3 Highlanders vs. Blues Apr 18 Highlanders 4.60
4 Brumbies vs. Rebels Apr 18 Brumbies 15.60
5 Force vs. Stormers Apr 18 Stormers -4.40
6 Sharks vs. Bulls Apr 18 Sharks 1.10
7 Cheetahs vs. Reds Apr 18 Cheetahs 6.90


April 14, 2015

Cumulative totals go up

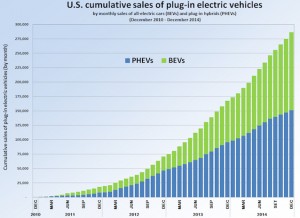
From ThinkProgress  (graph from Wikipedia) “U.S. plug-in electric vehicle cumulative sales have soared in the past few years, thanks in part to rapidly falling battery prices” and “A major reason for the rapid jump in EV sales is the rapid drop in the cost of their key component -– batteries.”

US_PEV_Sales_2010_2014

From a cumulative graph it’s hard to tell whether the cumulative sales have soared due to rapidly falling battery prices or just due to the fact that cumulative sales have to increase, but the past few years look pretty much like straight lines to me.

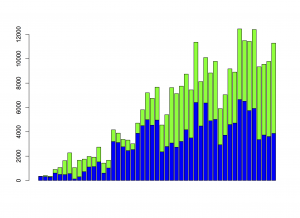
Here’s the noncumulative monthly sales, with the same colour-coding: there hasn’t been a big increase in the rate of sales during 2013 or 2014, so it’s not clear there’s much for falling battery prices to explain. Beyond the graph, for the first three months of 2015 there have been slightly few sales than in the first three months of 2014.

noncumulative

Cumulative sales of a new technology with sizeable network effects are important: it matters how many plug-in vehicles are out there. A cumulative graph is still a bad way to see patterns.


Northland school lunch numbers

Last week’s Stat of the Week nomination for the Northern Advocate didn’t, we thought point out anything particularly egregious. However, it did provoke me to read the story — I’d previously only  seen the headline 22% statistic on Twitter.  The story starts

Northland is in “crisis” as 22 per cent of students from schools surveyed turn up without any or very little lunch, according to the Te Tai Tokerau Principals Association.

‘Surveyed’ is presumably a gesture in the direction of the non-response problem: it’s based on information from about 1/3 of schools, which is made clear in the story. And it’s not as if the number actually matters: the Te Tai Tokerau Principals Association basically says it would still be a crisis if the truth was three times lower (ie, if there were no cases in schools that didn’t respond), and the Government isn’t interested in the survey.

More evidence that number doesn’t matter is that no-one seems to have done simple arithmetic. Later in the story we read

The schools surveyed had a total of 7352 students. Of those, 1092 students needed extra food when they came to school, he said.

If you divide 1092 by 7352 you don’t get 22%. You get 15%.  There isn’t enough detail to be sure what happened, but a plausible explanation is that 22% is the simple average of the proportions in the schools that responded, ignoring the varying numbers of students at each school.

The other interesting aspect of this survey (again, if anyone cared) is that we know a lot about schools and so it’s possible to do a lot to reduce non-response bias.  For a start, we know the decile for every school, which you’d expect to be related to food provision and potentially to response. We know location (urban/rural, which district). We know which are State Integrated vs State schools, and which are Kaupapa Māori. We know the number of students, statistics about ethnicity. Lots of stuff.

As a simple illustration, here’s how you might use decile and district information.  In the Far North district there are (using Wikipedia because it’s easy) 72 schools.  That’s 22 in decile one, 23 in decile two, 16 in decile three, and 11 in deciles four and higher.  If you get responses from 11 of the decile-one schools and only 4 of the decile-three schools, you need to give each student in those decile-one schools a weight of 22/11=2 and each student in the decile-three schools a weight of 16/4=4. To the extent that decile predicts shortage of food you will increase the precision of your estimate, and to the extent that decile also predicts responding to the survey you will reduce the bias.

This basic approach is common in opinion polls. It’s the reason, for example, that the Green Party’s younger, mobile-phone-using support isn’t massively underestimated in election polls. In opinion polls, the main limit on this reweighting technique is the limited amount of individual information for the whole population. In surveys of schools there’s a huge amount of information available, and the limit is sample size.

April 13, 2015

Puppy prostate perception

The Herald tells us “Dogs have a 98 per cent reliability rate in sniffing out prostate cancer, according to newly-published research.” Usually, what’s misleading about this sort of conclusion is the base-rate problem: if a disease is rare, 98% accuracy isn’t good enough. Prostate cancer is different.

Blood tests for prostate cancer are controversial because prostate tumours are common in older men, but only some tumours progress to cause actual illness.  By “controversial” I don’t mean the journalistic euphemism for “there are a few extremists who aren’t convinced”, but actually controversial.  Groups of genuine experts, trying to do the best for patients, can come to very different conclusions on when testing is beneficial.

The real challenge in prostate cancer screening is to distinguish the tumours you don’t want to detect from the ones you really, really do want to detect. The real question for the canine sniffer test is how well it does on this classification.

Since the story doesn’t give the researchers’s names finding the actual research takes more effort than usual. When you track the paper down it turns out that the dogs managed almost perfect discrimination between men with prostate tumours and everyone else. They detected tumours that were advanced and being treated, low-risk tumours that had been picked up by blood tests, and even minor tumours found incidentally in treatment for prostate enlargement. Detection didn’t depend on tumour size, on stage of disease, on PSA levels, or basically anything. As the researchers observed “The independence of tumor volume and aggressiveness, and the dog detection rate is surprising.”

Surprising, but also disappointing. Assuming the detection rate is real — and they do seem to have taken precautions against the obvious biases — the performance of the dogs is extremely impressive. However, the 98% accuracy in distinguishing people with and without prostate tumours unavoidably translates into a much lower accuracy in distinguishing tumours you want to detect from those you don’t want to detect.

Stat of the Week Competition: April 11 – 17 2015

Each week, we would like to invite readers of Stats Chat to submit nominations for our Stat of the Week competition and be in with the chance to win an iTunes voucher.

Here’s how it works:

  • Anyone may add a comment on this post to nominate their Stat of the Week candidate before midday Friday April 17 2015.
  • Statistics can be bad, exemplary or fascinating.
  • The statistic must be in the NZ media during the period of April 11 – 17 2015 inclusive.
  • Quote the statistic, when and where it was published and tell us why it should be our Stat of the Week.

Next Monday at midday we’ll announce the winner of this week’s Stat of the Week competition, and start a new one.

(more…)