Posts from June 2016 (41)

June 15, 2016

NRL Predictions for Round 15

Team Ratings for Round 15

The basic method is described on my Department home page.

Here are the team ratings prior to this week’s games, along with the ratings at the start of the season.

Current Rating Rating at Season Start Difference
Storm 10.68 4.41 6.30
Cowboys 10.48 10.29 0.20
Broncos 8.30 9.81 -1.50
Sharks 6.64 -1.06 7.70
Bulldogs 3.05 1.50 1.60
Raiders 2.45 -0.55 3.00
Eels -0.07 -4.62 4.60
Panthers -0.24 -3.06 2.80
Roosters -1.34 11.20 -12.50
Sea Eagles -1.67 0.36 -2.00
Rabbitohs -2.28 -1.20 -1.10
Warriors -3.49 -7.47 4.00
Dragons -3.56 -0.10 -3.50
Titans -4.27 -8.39 4.10
Wests Tigers -5.88 -4.06 -1.80
Knights -17.13 -5.41 -11.70


Performance So Far

So far there have been 107 matches played, 63 of which were correctly predicted, a success rate of 58.9%.
Here are the predictions for last week’s games.

Game Date Score Prediction Correct
1 Broncos vs. Raiders Jun 09 26 – 18 9.00 TRUE
2 Wests Tigers vs. Rabbitohs Jun 10 30 – 14 -6.70 FALSE
3 Knights vs. Warriors Jun 11 14 – 50 -5.50 TRUE
4 Eels vs. Titans Jun 11 22 – 12 3.20 TRUE
5 Roosters vs. Storm Jun 11 0 – 46 -3.40 TRUE
6 Sea Eagles vs. Panthers Jun 12 24 – 31 3.00 FALSE
7 Dragons vs. Bulldogs Jun 13 16 – 34 -4.80 TRUE
8 Sharks vs. Cowboys Jun 13 13 – 10 -1.60 FALSE


Predictions for Round 15

Here are the predictions for Round 15. The prediction is my estimated expected points difference with a positive margin being a win to the home team, and a negative margin a win to the away team.

Game Date Winner Prediction
1 Rabbitohs vs. Eels Jun 17 Rabbitohs 0.80
2 Dragons vs. Storm Jun 18 Storm -11.20
3 Warriors vs. Roosters Jun 19 Warriors 1.80
4 Titans vs. Sea Eagles Jun 20 Titans 0.40


June 14, 2016

Why everyone trusts us

  • In the UK, there’s been a big increase in the use of National Health Service data to track illegal immigrants — this was previously just done for serious criminals. (Buzzfeed)
  • CHICAGO — In this city’s urgent push to rein in gun and gang violence, the Police Department is keeping a list. Derived from a computer algorithm that assigns scores based on arrests, shootings, affiliations with gang members and other variables, the list aims to predict who is most likely to be shot soon or to shoot someone. New York Times
  • There’s a new UK website that does detailed analysis of your social media to tell your landlord whether you’ll be able to pay your rent. “If you’re living a normal life,” Thornhill reassures me, “then, frankly, you have nothing to worry about.” (Washington Post)
  • “We don’t turn people away,” Might said, but the cable company’s technicians aren’t going to “spend 15 minutes setting up an iPhone app” for a customer who has a low FICO score.  (fiercecable, via mathbabe.org)
  • Another startupclaims it can “reveal” your personality “with a high level of accuracy” just by analyzing your face, be that facial image captured via photo, live-streamed video, or stored in a database. It then sorts people into categories; with some labels as potentially dangerous such as terrorist or pedophile,” (also via mathbabe.org)
June 13, 2016

Reasonable grounds

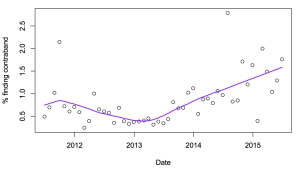
Mark Hanna submitted an OIA request about strip searches in NZ prisons, which carried out with ‘reasonable grounds to believe’ the prisoner has an unauthorised item.  You can see the full response at FYI. He commented that 99.3% of these searches find nothing.

Here’s the monthly data over time:

searches
The positive predictive value of having ‘reasonable grounds’  is increasing, and is up to about 1.5% now. That’s still pretty low. How ‘reasonable’ it is depends on what proportion of the time people who aren’t searched have unauthorised items: if that were, say, 1 in 1000, having ‘reasonable grounds’ would be increasing it 5-15-fold, which might conceivably count as reasonable.

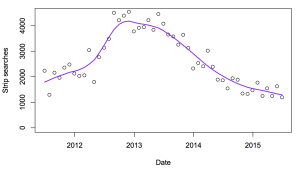
We can look at the number of searches conducted, to see if that tells us anything about trends
conducted
Again, there’s a little good news: the number of strip searches has fallen over the the past couple of years. That’s a real rise and fall — the prison population has been much more stable. The trend looks very much like the first trend upside down.

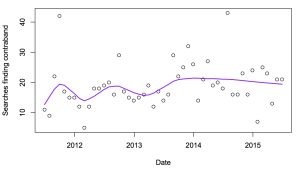
Here’s the trend for number (not proportion) of searches finding something
finds
It’s pretty much constant over time.

Statistical models confirm what the pictures suggest: the number of successful searches is essentially uncorrelated with the total number of searches. This is also basically good news (for the future, if not the past): it suggests that a further reduction in strip searches may well be possible at no extra risk.

Stat of the Week Competition: June 11 – 17 2016

Each week, we would like to invite readers of Stats Chat to submit nominations for our Stat of the Week competition and be in with the chance to win an iTunes voucher.

Here’s how it works:

  • Anyone may add a comment on this post to nominate their Stat of the Week candidate before midday Friday June 17 2016.
  • Statistics can be bad, exemplary or fascinating.
  • The statistic must be in the NZ media during the period of June 11 – 17 2016 inclusive.
  • Quote the statistic, when and where it was published and tell us why it should be our Stat of the Week.

Next Monday at midday we’ll announce the winner of this week’s Stat of the Week competition, and start a new one.

(more…)

Stat of the Week Competition Discussion: June 11 – 17 2016

If you’d like to comment on or debate any of this week’s Stat of the Week nominations, please do so below!

June 12, 2016

Walking it back

First the headline (Herald, reprinting Daily Telegraph)

Finger-prick test that can show risk of diabetes

then it’s “on the horizon”

The finger-prick test, which could be available at GP surgeries or even chemists, looks for molecules in the blood that indicate diabetes is developing.

but in the present tense. Then

The specific biomarkers involved are being kept a closely guarded secret for now, but once a prototype test has been developed, trials will take place.

This ‘test’ not only hasn’t been evaluated in real patients; it doesn’t even exist yet.

And

Currently, doctors can test for diabetes only by taking blood glucose readings that show whether the disease is already present.

That’s only true if you squint from exactly the right angle. Since 2012, testing for HbA1c, a byproduct of elevated glucose, has been a general screening recommendation in NZ and one of the public health performance indicators. One of the reasons given for screening is

effective screening aims to reduce the incidence of diabetes through detection of people with pre-diabetes

You could argue ‘the disease is already present’ in people with pre-diabetes, but not in the sense that’s relevant to screening.

The current test isn’t all that good, and perhaps when they finish inventing it the new one will be better. But it’s not a test yet; it’s not a ‘health’ story yet; and with so little disclosed information it’s not clear that it’s even a science story yet.

June 11, 2016

Briefly

  • from Wired: Transitland collects and aggregates transit data feeds from around the world. Though apparently not this part of the world
  • How do you study the impact of changes from the ‘sharing economy’?  Andrew Gelman and Tom Slee on AirBNB “Academics now tend to ask me (a) how to refer to the data set, and (b) how they can validate it for publication purposes, to which I generally reply (a) I have no idea, and (b) I have no idea”. Sarah Emerson on Uber

Crimes and data limitations

There’s another neat interactive map at Herald Insights, this time of meshblock-level data on assaults in public places reported to the police. It’s a good job, but I still want to talk about some of the limitations forced on the graphics by the available data.

The most obviously strange thing about the map is the hospitals: in Auckland, two of the big hotspots are Auckland City Hospital and Middlemore Hospital. When we talk about hospitals being dangerous places, we usually mean surgical errors or drug-resistant bacteria, not assault. There are two relatively boring reasons that the hospitals stand out, which they share with the town and city centres: the hospitals have a lot of people in them, and they are public places.

In the Herald map, the colour coding reflects the number of reported victimisations, not a rate per capita.  That’s because the right population of capitas is hard to define and not readily available.  We know the number of people who live in each meshblock, and the number who work in each meshblock, but the assaults are those in public places. When you’re at home — and for many people, when you’re working — you aren’t in a public place.   There isn’t easily-available data on the number of people in public places, at meshblock resolution, for the whole country.

The other question the hospital data should raise when talking about the most dangerous areas is ‘dangerous to whom’? Who gets assaulted in hospitals?  I don’t know, but I’d expect staff are at reasonably high risk, and so are people who have already been fighting before they arrived.  It might well be that hospitals are pretty safe for people just going there because their chest hurts or they decided to mow the lawn barefoot.

June 8, 2016

Evidence and stroke

If you’re in New Zealand, there’s a good chance you’ve seen the Stroke Foundation’s new TV ad campaign describing how to recognise a stroke and what to do about it (get the person to hospital Right Now). I often criticise the evidence behind health stories in the news, so it’s worth looking at how different this is.

A Herald story says

Up to half of all stroke cases could be treated with clot-busting drugs if they arrived within three hours of the stroke’s onset at a hospital.

That’s a little optimistic. There are basically three categories:

  • strokes caused by bleeding
  • strokes caused by clots, where the brain cells haven’t had time to die
  • strokes caused by clots, but where the brain cells have had time to die

In the second group, dissolving the blood clot is helpful — it reduces the risk of both death and disability. In the first group it’s definitely harmful, and in the third group it’s unhelpful and risks triggering bleeding. 

If you get a stroke victim to hospital fast, there’s a good chance of getting them through emergency-room triage and diagnosis, and into a CT scan that can distinguish between groups one and two before it’s too late. But even if you react quickly, that’s a lot of things that have to go right — and a lot of them have to happen after you get to hospital.  The current NZ stroke guidelines say that treating 20% of cases is a realistic target: a bit less than half of those who could benefit in a perfect world.

So, how do we know the treatment is helpful, and for whom?  As with clot-dissolving treatment for heart attacks, this isn’t easy.  In particular, it’s fairly obvious which patients are harmed by treatment — they end up with bleeding in their brains — but it’s much harder to tell which patients are helped, and by how much.

The only solution is randomised trials, where patients were randomly assigned to clot-dissolving drugs or the standard treatment.  These trials need careful design, both practically and ethically. You’re introducing new diagnosis and treatment steps into over-stressed hospital emergency rooms; you’re using a treatment that might be life-saving or lethal; you’re targeting people who (by definition) don’t have their brains in good working order.  The trials were done: we now have 27 trials in 10,000 patients, and clot-dissolving treatment does more good than harm — unambiguously, if started within 3 hours from the start of symptoms and probably somewhat later, but not the next day.

In terms of evidence, this isn’t at the levels of getting vaccinated and stopping smoking, but it’s miles ahead of the evidence around fish oil or vitamin supplements or coconut oil or kids these days and their phones and internets.

NRL Predictions for Round 14

Team Ratings for Round 14

The basic method is described on my Department home page.

Here are the team ratings prior to this week’s games, along with the ratings at the start of the season.

Current Rating Rating at Season Start Difference
Cowboys 10.84 10.29 0.50
Broncos 8.38 9.81 -1.40
Storm 7.85 4.41 3.40
Sharks 6.27 -1.06 7.30
Raiders 2.37 -0.55 2.90
Bulldogs 2.12 1.50 0.60
Roosters 1.49 11.20 -9.70
Eels -0.56 -4.62 4.10
Rabbitohs -0.72 -1.20 0.50
Sea Eagles -0.96 0.36 -1.30
Panthers -0.96 -3.06 2.10
Dragons -2.63 -0.10 -2.50
Titans -3.78 -8.39 4.60
Warriors -5.55 -7.47 1.90
Wests Tigers -7.43 -4.06 -3.40
Knights -15.07 -5.41 -9.70


Performance So Far

So far there have been 99 matches played, 58 of which were correctly predicted, a success rate of 58.6%.
Here are the predictions for last week’s games.

Game Date Score Prediction Correct
1 Raiders vs. Sea Eagles Jun 03 30 – 18 5.40 TRUE
2 Warriors vs. Broncos Jun 04 36 – 18 -14.30 FALSE
3 Cowboys vs. Knights Jun 04 46 – 16 28.70 TRUE
4 Storm vs. Panthers Jun 04 24 – 6 10.80 TRUE
5 Roosters vs. Wests Tigers Jun 05 32 – 18 11.50 TRUE
6 Rabbitohs vs. Titans Jun 05 28 – 29 3.80 FALSE
7 Bulldogs vs. Sharks Jun 06 18 – 20 -1.00 TRUE


Predictions for Round 14

Here are the predictions for Round 14. The prediction is my estimated expected points difference with a positive margin being a win to the home team, and a negative margin a win to the away team.

Game Date Winner Prediction
1 Broncos vs. Raiders Jun 09 Broncos 9.00
2 Wests Tigers vs. Rabbitohs Jun 10 Rabbitohs -6.70
3 Knights vs. Warriors Jun 11 Warriors -5.50
4 Eels vs. Titans Jun 11 Eels 3.20
5 Roosters vs. Storm Jun 11 Storm -3.40
6 Sea Eagles vs. Panthers Jun 12 Sea Eagles 3.00
7 Dragons vs. Bulldogs Jun 13 Bulldogs -4.80
8 Sharks vs. Cowboys Jun 13 Cowboys -1.60