Posts from May 2017 (30)

May 22, 2017

Stat of the Week Competition: May 20 – 26 2017

Each week, we would like to invite readers of Stats Chat to submit nominations for our Stat of the Week competition and be in with the chance to win an iTunes voucher.

Here’s how it works:

  • Anyone may add a comment on this post to nominate their Stat of the Week candidate before midday Friday May 26 2017.
  • Statistics can be bad, exemplary or fascinating.
  • The statistic must be in the NZ media during the period of May 20 – 26 2017 inclusive.
  • Quote the statistic, when and where it was published and tell us why it should be our Stat of the Week.

Next Monday at midday we’ll announce the winner of this week’s Stat of the Week competition, and start a new one.

(more…)

Stat of the Week Competition Discussion: May 20 – 26 2017

If you’d like to comment on or debate any of this week’s Stat of the Week nominations, please do so below!

May 20, 2017

Bright sunshiny day

Q: Isn’t Study suggests we need this first-thing in the morning a perfect example of click-bait?

A: Impressive. And what is this?

Q: This is daylight.

A: Makes sense.  And fits with the picture of someone stretching after getting out of bed.

Q: Does it fit the research?

A: Um.  Not so much. (link)

Q: Not people?

A: No, it was people. It’s just it was light exposure in office buildings.

Q: And these buildings weren’t where people slept?

A: No, that would be potentially inappropriate. It was where they worked.

Q: But giving people more light helped with sleep and depression?

A: “the study did not include a lighting intervention”

Q: So they compared people who had offices with windows and natural light to everyone else?

A: Basically.

Q: And there was a difference in how much sleep they got?

A: No.

Q: In whether they woke up a lot?

A: Not really. The ‘sleep efficiency’ was pretty much the same.

Q: In what, then?

A: In how long they took to fall asleep.

Q: And the depression and stress?

A: Well, the differences were statistically detectable, but they weren’t all that big.

Q: But wouldn’t you expect people with windows in their offices to be happier?

A: Yes. It’s a bit surprising how small the differences were in this study.

Q: So the headline is a bit exaggerated?

A: It’s worse than that. The headline says the research is about what you should have been doing, but it’s actually about what your employer should be doing.

May 17, 2017

Briefly

  • From the NY Times: In a survey of geographical knowledge and attitudes to North Korea, Americans who can tell their arse from their elbow are more likely to favour diplomacy.  This is different from the Agrabah question, because survey participants aren’t being lied to.
  • Perceptions of bias — more precisely, claims about perceptions of bias — are very different between Democrats and Republicans in the US, according to analysis at 538.  Democrats are likely to say they think whites and Christians don’t get discriminated against much but blacks, Muslims, immigrants, gays & lesbians do. For all the groups, about a third of Republicans say they think there’s a lot of discrimination.
  • Difficulties with doing randomised experiments on social issues, from the Brookings Institution.  One of the big problems is that there isn’t good theory to allow the results of an experiment to be generalised, in contrast to drug trials where we have a pretty reasonable idea of what it means when a drug does well in a randomised trial population.  A lot of the difficulties do generalise to public health interventions, though. On a related note, economist Noah Smith talks about the role of theory and experiment in economics and in science.
  • I wrote last year about judges interrupting each other in the US Supreme Court and whether it depended on gender — the analysis in the media had ignored how much each judge talked.  There’s now an analysis with more variables (and now the right link), and the gender difference looks stronger.
May 16, 2017

Super 18 Predictions for Round 13

Team Ratings for Round 13

The basic method is described on my Department home page.

Here are the team ratings prior to this week’s games, along with the ratings at the start of the season.

Current Rating Rating at Season Start Difference
Hurricanes 16.70 13.22 3.50
Crusaders 14.56 8.75 5.80
Highlanders 9.02 9.17 -0.10
Lions 8.64 7.64 1.00
Chiefs 8.54 9.75 -1.20
Blues 3.53 -1.07 4.60
Brumbies 1.74 3.83 -2.10
Stormers 0.63 1.51 -0.90
Sharks 0.54 0.42 0.10
Waratahs -0.91 5.81 -6.70
Jaguares -4.04 -4.36 0.30
Bulls -4.32 0.29 -4.60
Force -7.76 -9.45 1.70
Cheetahs -9.53 -7.36 -2.20
Reds -10.32 -10.28 -0.00
Kings -12.52 -19.02 6.50
Rebels -14.79 -8.17 -6.60
Sunwolves -16.80 -17.76 1.00


Performance So Far

So far there have been 94 matches played, 71 of which were correctly predicted, a success rate of 75.5%.
Here are the predictions for last week’s games.

Game Date Score Prediction Correct
1 Blues vs. Cheetahs May 12 50 – 32 16.90 TRUE
2 Brumbies vs. Lions May 12 6 – 13 -2.30 TRUE
3 Crusaders vs. Hurricanes May 13 20 – 12 -3.50 FALSE
4 Rebels vs. Reds May 13 24 – 29 -0.40 TRUE
5 Bulls vs. Highlanders May 13 10 – 17 -9.70 TRUE
6 Kings vs. Sharks May 13 35 – 32 -11.30 FALSE
7 Jaguares vs. Force May 13 6 – 16 10.10 FALSE


Predictions for Round 13

Here are the predictions for Round 13. The prediction is my estimated expected points difference with a positive margin being a win to the home team, and a negative margin a win to the away team.

Game Date Winner Prediction
1 Chiefs vs. Crusaders May 19 Crusaders -2.50
2 Stormers vs. Blues May 19 Stormers 1.10
3 Hurricanes vs. Cheetahs May 20 Hurricanes 30.20
4 Force vs. Highlanders May 20 Highlanders -12.80
5 Sunwolves vs. Sharks May 20 Sharks -13.30
6 Kings vs. Brumbies May 20 Brumbies -10.30
7 Lions vs. Bulls May 20 Lions 16.50
8 Waratahs vs. Rebels May 21 Waratahs 17.40


NRL Predictions for Round 11

Team Ratings for Round 11

The basic method is described on my Department home page.

Here are the team ratings prior to this week’s games, along with the ratings at the start of the season.

Current Rating Rating at Season Start Difference
Storm 7.03 8.49 -1.50
Sharks 6.54 5.84 0.70
Broncos 6.27 4.36 1.90
Raiders 4.62 9.94 -5.30
Roosters 2.76 -1.17 3.90
Sea Eagles 1.55 -2.98 4.50
Cowboys 1.21 6.90 -5.70
Panthers 0.41 6.08 -5.70
Dragons 0.27 -7.74 8.00
Titans 0.01 -0.98 1.00
Eels -2.20 -0.81 -1.40
Bulldogs -2.68 -1.34 -1.30
Rabbitohs -4.01 -1.82 -2.20
Warriors -4.38 -6.02 1.60
Wests Tigers -6.81 -3.89 -2.90
Knights -12.65 -16.94 4.30


Performance So Far

So far there have been 80 matches played, 43 of which were correctly predicted, a success rate of 53.8%.
Here are the predictions for last week’s games.

Game Date Score Prediction Correct
1 Bulldogs vs. Cowboys May 11 14 – 30 2.50 FALSE
2 Dragons vs. Sharks May 12 14 – 18 -2.50 TRUE
3 Wests Tigers vs. Rabbitohs May 12 8 – 28 4.50 FALSE
4 Panthers vs. Warriors May 13 36 – 28 9.00 TRUE
5 Storm vs. Titans May 13 36 – 38 12.90 FALSE
6 Sea Eagles vs. Broncos May 13 14 – 24 0.50 FALSE
7 Knights vs. Raiders May 14 34 – 20 -18.70 FALSE
8 Roosters vs. Eels May 14 48 – 10 3.20 TRUE


Predictions for Round 11

Here are the predictions for Round 11. The prediction is my estimated expected points difference with a positive margin being a win to the home team, and a negative margin a win to the away team.

Game Date Winner Prediction
1 Sharks vs. Cowboys May 18 Sharks 8.80
2 Warriors vs. Dragons May 19 Dragons -0.70
3 Broncos vs. Wests Tigers May 19 Broncos 16.60
4 Titans vs. Sea Eagles May 20 Titans 2.00
5 Eels vs. Raiders May 20 Raiders -3.30
6 Knights vs. Panthers May 21 Panthers -9.60
7 Bulldogs vs. Roosters May 21 Roosters -1.90
8 Rabbitohs vs. Storm May 21 Storm -7.50


May 15, 2017

Stat of the Week Competition: May 13 – 19 2017

Each week, we would like to invite readers of Stats Chat to submit nominations for our Stat of the Week competition and be in with the chance to win an iTunes voucher.

Here’s how it works:

  • Anyone may add a comment on this post to nominate their Stat of the Week candidate before midday Friday May 19 2017.
  • Statistics can be bad, exemplary or fascinating.
  • The statistic must be in the NZ media during the period of May 13 – 19 2017 inclusive.
  • Quote the statistic, when and where it was published and tell us why it should be our Stat of the Week.

Next Monday at midday we’ll announce the winner of this week’s Stat of the Week competition, and start a new one.

(more…)

Stat of the Week Competition Discussion: May 13 – 19 2017

If you’d like to comment on or debate any of this week’s Stat of the Week nominations, please do so below!

May 14, 2017

There’s nothing like a good joke

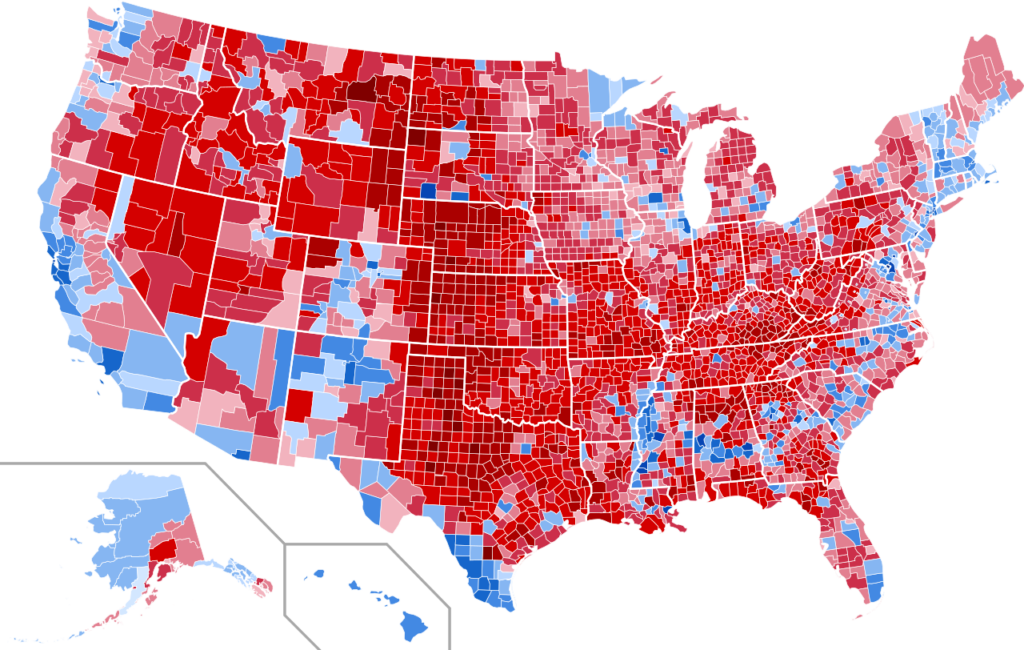
You’ve probably seen the 2016 US election results plotted by county, as in this via Brilliant Maps
county

It’s not ideal, because large, relatively empty counties take up a lot of space but represent relatively few people.  It’s still informative: you can see, for example, that urban voters tended to support Clinton even in Texas.  There are also interesting blue patches in rural areas that you might need an atlas to understand.

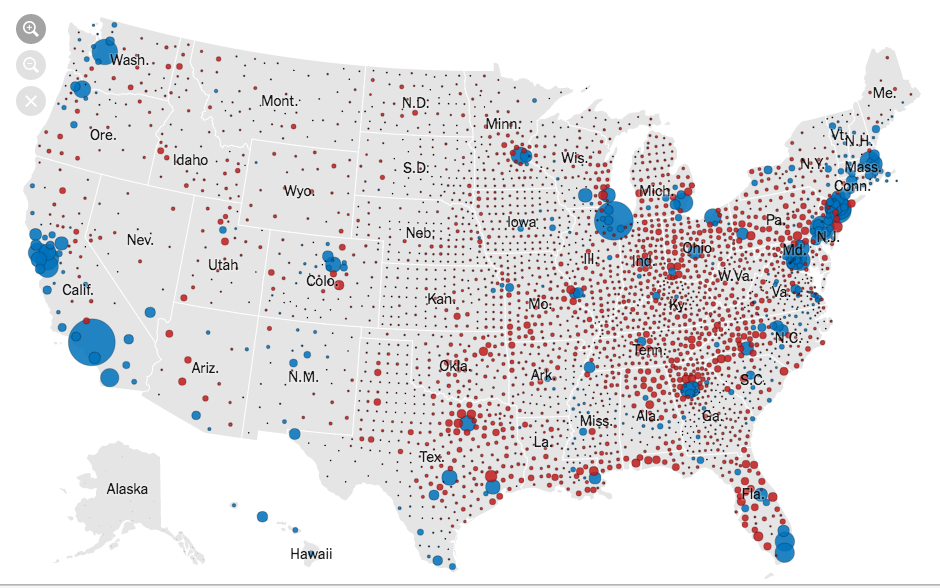
For most purposes, it’s better to try to show the votes, such as this from the New York Times, where the circle area is proportional to the lead in votes
nyt

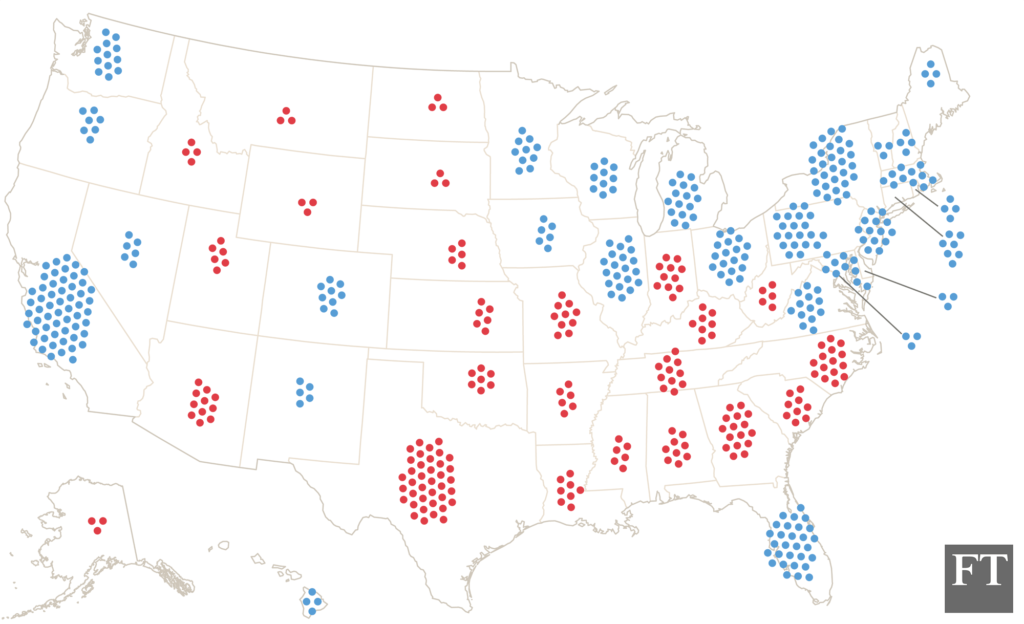
You might want something that shows the Electoral College votes, since those are what actually determines the results, like this by Tom Pearson for the Financial Times
ec-dot

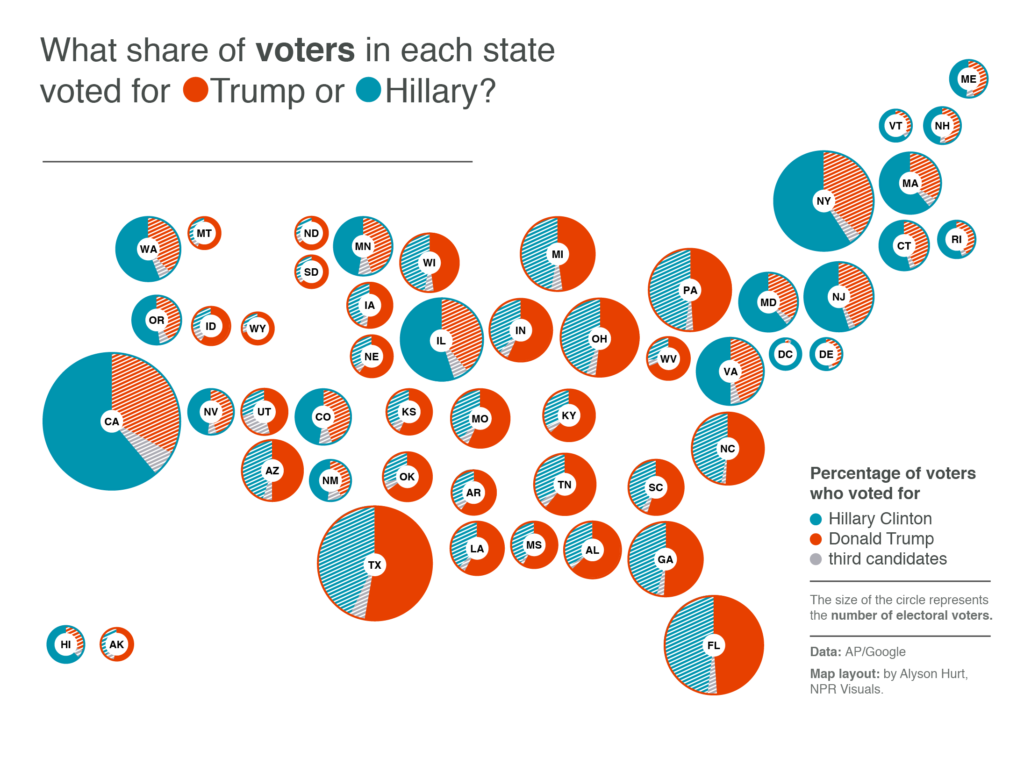
Or, you might like pie charts, such as this one from Lisa Charlotte Rost

rost-pie

These all try to improve on the simple county map by showing votes — people — rather than land. The NYT one is more complex than the straightforward map; the other two are simpler but still informative.


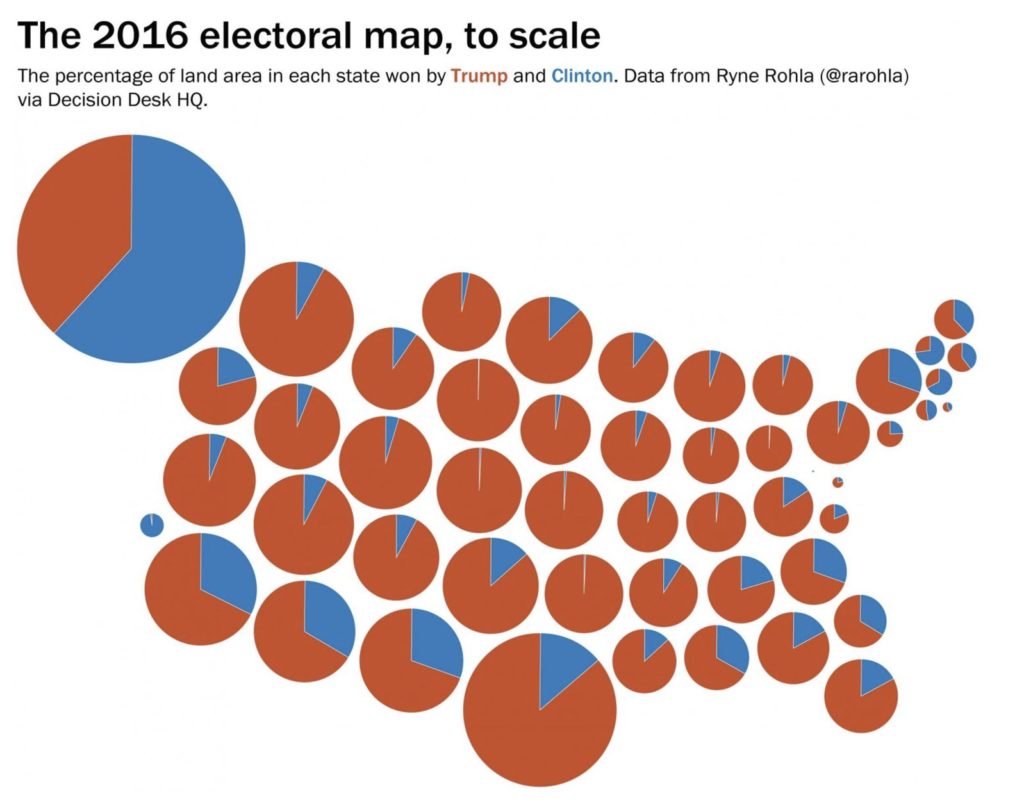
Or, you could simplify the county map in another way. You could remove all the spatial information from within states — collecting the ‘blue’ land into one wedge and the ‘red’ land into another — and not add anything. You might do this as a joke, to comment on the President’s use of the simple county map
pie

The problem with the Internet, though, is that people might take it seriously.  It’s not completely clear whether Chris Cillizza was just trolling, but a lot of people sure seem to take his reposting of it seriously.

May 10, 2017

Bombs away

Q: Did you see the Jagerbombs ‘as bad as taking cocaine’ headline in the Herald?

A: Doesn’t sound all that plausible. What’s a Jagerbomb? Is it like a Molotov cocktail?

Q: Apparently it’s Red Bull with Jägermeister.

A: Well, I don’t think I’m in any danger of drinking that.  How did you get the little dotty things over the ‘a’, by the way?

Q: If you hold down the ‘a’ key they pop up as an option (on a Mac). Like the Māori long vowels. But we nearly digress. Is a Jagerbomb really that dangerous?

A: Well, the story goes on to quote the researcher saying “I wondered if they were having a similar impact but to a lesser degree”

Q: And are they?

A: For suitable definitions of ‘same’ and ‘lesser’. And ‘were’.

Q: ಠ_ಠ

A: The research (no link given) looked at whether combining alcohol and energy drinks led to people getting injured more.

Q: That’s not the first thing you think of as a risk of taking cocaine. And how did they do the comparison? Recruit undergraduates with poor taste and give them Jagerbombs?

A: No

Q: You’re not going to say ‘mice’, are you?

A: No, what they did was go to the library and find all the previous studies of alcohol and energy drinks and injury, to review and summarise them.

Q: Is that useful?

A: It can be very useful. You can’t keep all that information in your head even if you’re a qualified Jagerbombologist.  Systematic reviews are a great innovation in modern medical research.

Q: So, how does the risk of injury compare to the risk with cocaine?

A: They didn’t look at that.

Q: Oh. Ok. So how big is the risk?

A: They didn’t come up with anything quantitative, because the previous research studies hadn’t been done in a similar enough way

Q: Did they come up with anything?

A: Yes, the results “suggest support for a relationship between increased risk of injury and [alcohol with energy drink] use”

Q: That’s not all that strong.

A: No.

Q: Was there a stronger relationship than just with alcohol on its own?

A: They say “some studies did not differentiate between injuries occurring in alcohol-only sessions relative to AmED sessions, making a comparison of the risk of injury between alcohol and AmED use impossible.

Q: Even if there is a difference, couldn’t it be that the sort of people who drink Jagerbombs or rum and Coke are different from people who drink beer, or cosmopolitans, or Sauv Blanc?

A: “Although the results remain mixed in terms of whether impulsivity or risk taking may moderate the relationship between AmED use and injury risk, there is enough evidence to warrant further exploration.”

Q: That all seems very reasonable.

A: The actual story isn’t too bad, either. Just the web-front-page headline.

Q: Wait, doesn’t the headline punctuation imply ‘as bad as taking cocaine’ is a quote? When it totally isn’t?

A: Yes. Yes, it does.