Posts from October 2020 (25)

October 6, 2020

Rugby Premiership Predictions for Round 22

Team Ratings for Round 22

OK, so this is late, with only one game to play. It has been a crazy time trying to keep up with changes to fixtures. The Gloucester versus Northampton game was forfeited by Northampton and the result given to Gloucester 20-0. I think I will follow FlashScore on that game and ignore the allocated result.

I have also missed the start of the Pro14. I haven’t even sorted out the fixtures for that yet, or chosen parameters, but will catch up tomorrow I hope.

The basic method is described on my Department home page.
Here are the team ratings prior to this week’s games, along with the ratings at the start of the season.

Current Rating Rating at Season Start Difference
Exeter Chiefs 8.81 7.99 0.80
Saracens 6.98 9.34 -2.40
Sale Sharks 6.91 0.17 6.70
Wasps 6.21 0.31 5.90
Bath 3.51 1.10 2.40
Bristol 2.62 -2.77 5.40
Gloucester -0.72 0.58 -1.30
Harlequins -0.99 -0.81 -0.20
Northampton Saints -3.94 0.25 -4.20
Worcester Warriors -6.74 -2.69 -4.10
Leicester Tigers -7.56 -1.76 -5.80
London Irish -8.88 -5.51 -3.40


Performance So Far

So far there have been 126 matches played, 83 of which were correctly predicted, a success rate of 65.9%.
Here are the predictions for last week’s games.

Game Date Score Prediction Correct
1 Bath vs. Gloucester Sep 23 31 – 20 8.30 TRUE
2 Bristol vs. Leicester Tigers Sep 29 40 – 3 12.20 TRUE
3 Exeter Chiefs vs. London Irish Sep 30 19 – 22 24.90 FALSE
4 Harlequins vs. Wasps Oct 01 23 – 32 -1.80 TRUE
5 Northampton Saints vs. Sale Sharks Oct 01 14 – 34 -4.70 TRUE
6 Worcester Warriors vs. Saracens Oct 01 40 – 27 -11.70 FALSE


Predictions for Round 22

Here are the predictions for Round 22. The prediction is my estimated expected points difference with a positive margin being a win to the home team, and a negative margin a win to the away team.

Game Date Winner Prediction
1 Gloucester vs. Northampton Saints Oct 05 Gloucester 7.70
2 Leicester Tigers vs. Harlequins Oct 05 Harlequins -2.10
3 London Irish vs. Bristol Oct 05 Bristol -7.00
4 Sale Sharks vs. Worcester Warriors Oct 08 Sale Sharks 18.10
5 Saracens vs. Bath Oct 05 Saracens 8.00
6 Wasps vs. Exeter Chiefs Oct 05 Wasps 1.90


NRL Predictions for Finals Week 2

Team Ratings for Finals Week 2

The basic method is described on my Department home page.
Here are the team ratings prior to this week’s games, along with the ratings at the start of the season.

Current Rating Rating at Season Start Difference
Storm 13.59 12.73 0.90
Roosters 10.80 12.25 -1.40
Panthers 9.02 -0.13 9.20
Rabbitohs 7.20 2.85 4.40
Raiders 7.16 7.06 0.10
Eels 2.29 2.80 -0.50
Sharks -0.76 1.81 -2.60
Warriors -1.84 -5.17 3.30
Knights -2.61 -5.92 3.30
Wests Tigers -3.07 -0.18 -2.90
Sea Eagles -4.77 1.05 -5.80
Dragons -4.95 -6.14 1.20
Titans -7.22 -12.99 5.80
Bulldogs -7.62 -2.52 -5.10
Cowboys -8.05 -3.95 -4.10
Broncos -11.16 -5.53 -5.60


Performance So Far

So far there have been 164 matches played, 113 of which were correctly predicted, a success rate of 68.9%.
Here are the predictions for last week’s games.

Game Date Score Prediction Correct
1 Panthers vs. Roosters Oct 02 29 – 28 0.00 TRUE
2 Raiders vs. Sharks Oct 03 32 – 20 9.50 TRUE
3 Storm vs. Eels Oct 03 36 – 24 11.10 TRUE
4 Rabbitohs vs. Knights Oct 04 46 – 20 10.20 TRUE


Predictions for Finals Week 2

Here are the predictions for Finals Week 2. The prediction is my estimated expected points difference with a positive margin being a win to the home team, and a negative margin a win to the away team.

Game Date Winner Prediction
1 Roosters vs. Raiders Oct 09 Roosters 5.60
2 Eels vs. Rabbitohs Oct 10 Rabbitohs -2.90


Mitre 10 Cup Predictions for Round 5

Team Ratings for Round 5

The basic method is described on my Department home page.
Here are the team ratings prior to this week’s games, along with the ratings at the start of the season.

Current Rating Rating at Season Start Difference
Tasman 13.94 15.13 -1.20
Auckland 8.13 6.75 1.40
Canterbury 7.84 8.40 -0.60
Wellington 7.33 6.47 0.90
Bay of Plenty 4.33 8.21 -3.90
Waikato 3.12 1.31 1.80
North Harbour 1.89 2.87 -1.00
Hawke’s Bay 1.64 0.91 0.70
Taranaki -4.12 -4.42 0.30
Otago -4.99 -4.03 -1.00
Northland -6.79 -8.71 1.90
Counties Manukau -9.13 -8.18 -1.00
Southland -10.11 -14.04 3.90
Manawatu -12.96 -10.57 -2.40


Performance So Far

So far there have been 28 matches played, 17 of which were correctly predicted, a success rate of 60.7%.
Here are the predictions for last week’s games.

Game Date Score Prediction Correct
1 Bay of Plenty vs. Auckland Oct 02 16 – 20 -0.20 TRUE
2 Counties Manukau vs. Manawatu Oct 03 36 – 30 7.00 TRUE
3 Northland vs. Taranaki Oct 03 35 – 25 -1.20 FALSE
4 Canterbury vs. Wellington Oct 03 31 – 26 3.10 TRUE
5 North Harbour vs. Tasman Oct 04 40 – 24 -12.50 FALSE
6 Southland vs. Waikato Oct 04 9 – 10 -11.70 TRUE
7 Otago vs. Hawke’s Bay Oct 04 9 – 28 -1.30 TRUE


Predictions for Round 5

Here are the predictions for Round 5. The prediction is my estimated expected points difference with a positive margin being a win to the home team, and a negative margin a win to the away team.

Game Date Winner Prediction
1 Manawatu vs. Canterbury Oct 09 Canterbury -17.80
2 Taranaki vs. Auckland Oct 10 Auckland -9.20
3 Wellington vs. Otago Oct 10 Wellington 15.30
4 Waikato vs. Counties Manukau Oct 10 Waikato 15.20
5 North Harbour vs. Hawke’s Bay Oct 11 North Harbour 3.30
6 Tasman vs. Bay of Plenty Oct 11 Tasman 12.60
7 Northland vs. Southland Oct 11 Northland 6.30


October 5, 2020

Auckland is bigger than Wellington

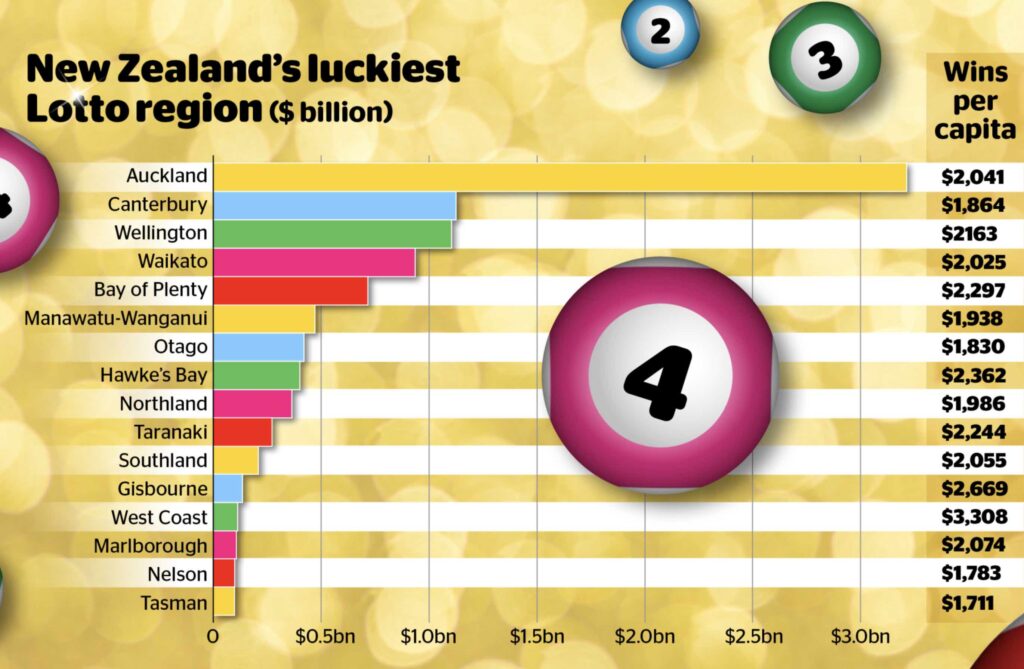
There’s a long interactive in the Herald prompted by the 2000th Lotto draw, earlier this week.  Among other interesting things, it has a graph of purporting to show the ‘luckiest’ regions

Aucklanders have won more money in Lotto prizes than any other region — roughly three times as much as either Canterbury or Wellington. By an amazing coincidence, Auckland has roughly three times the population of Canterbury or Wellington.  The bar chart is only showing population. Auckland is not punching above its weight.

Wins per capita are over on the side, and are much less variable. Some of this will be that people in different regions play Lotto more or less ofter; some probably was luck. It’s possible that some variation is due to strategy — not variation in whether you win, but in how much.

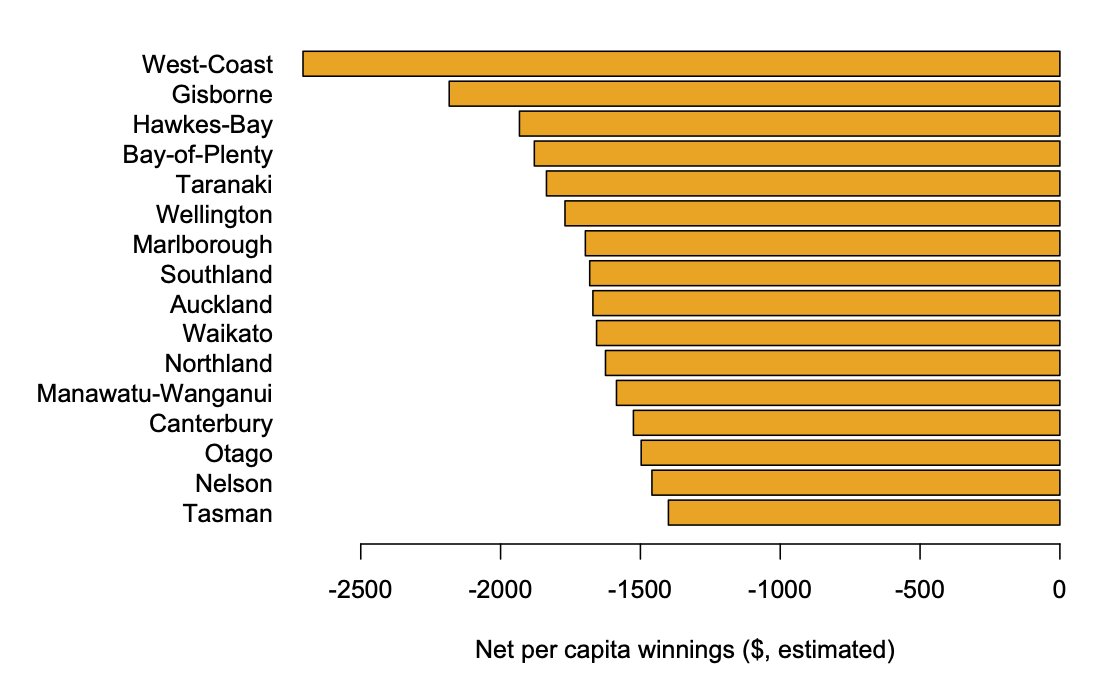
Perhaps more importantly, the ‘wins per capita’ figure is gross winnings, not net winnings.   Lotto NZ didn’t release details of expenditures, but 2000 draws is a long enough period of time that we can work with averages and get a rough estimate.  As the Herald reports, about 55c in the dollar goes in prizes, so the gross winnings will average about 55% of revenue and the net winnings will average -45% of revenue, or -9/11 times gross winnings.

So: as an estimate over the past 2000 draws, the ‘luckiest’ NZ regions


Some of the smaller regions are probably misrepresented here by good/bad luck — if Lotto NZ released actual data on revenue by region I’d be happy to do a more precise version

Auckland outbreak: the genomes

Marc Daalder at newsroom has a very good piece about genome sequencing and its role in handling the Auckland outbreak.

One thing I want to highlight is this family tree. It’s the B.1.1.1 clade of the virus, a particular viral subfamily

The samples from the Auckland outbreak are that blue/green cluster at the top. They’re all more closely related to each other than to any other sample that has been sequenced in NZ or anywhere else in the world, so we know they had a recent common ancestor: the virus that started the outbreak.

I’m mentioning this because I saw discussion on Twitter over the past month or so of the ‘B.1.1.1 clade’ and whether there had been other earlier cases from that clade in NZ and whether that meant the government was hiding something.  B.1.1.1 is a pretty broad family, going back to a common ancestor in late February.   If two samples are from different broad clades, they are different incursions to NZ, but if they’re from the same broad clade they aren’t necessarily the same incursion. You need the full sequence to say how closely viruses are related.