Posts from May 2025 (28)

May 28, 2025

Typical wedding

From RNZ this week

The Wedding Planner director Susannah Reid said in 2023 $58,000 was a typical budget for a wedding across New Zealand but this year, the average cost was more like $87,600.

As we’ve seen in the past, this use of ‘typical’ by people in the wedding industry doesn’t have a lot to do with how the word is normally used.  In that post, in 2014, the typical value from the marital-industrial complex was $30,000.  In 2025 dollars that’s about $40,000, so apparently the real cost of “typical” weddings has more than doubled over the time StatsChat has been running.

Radio NZ also have this week: How New Zealand couples saved on their wedding (and what they splurged on). The most expensive wedding here is less than a quarter of the “typical” budget; the others are less than 10%.

If you think about it, estimating the actual cost of a typical wedding is quite hard.  Technically it’s not that difficult: the government keeps track of marriages, so you could do a survey of a sample of marriages and ask people, but the Births, Deaths, and Marriages people will only let you browse arbitrary marriages from the distant past. Contemporary marriages are public records, but public access to them is by name rather than just by year.   If you don’t have a genuine sample, you’ll tend to notice big weddings more than small ones.
May 27, 2025

Super Rugby Predictions for the Quarter-finals

Team Ratings for the Quarter-finals

The basic method is described on my Department home page.
Here are the team ratings prior to this week’s games, along with the ratings at the start of the season.

Current Rating Rating at Season Start Difference
Chiefs 14.11 11.43 2.70
Blues 10.53 14.92 -4.40
Crusaders 9.74 8.99 0.80
Hurricanes 9.24 10.97 -1.70
Brumbies 6.54 6.19 0.30
Reds 1.63 1.35 0.30
Highlanders -2.69 -2.50 -0.20
Waratahs -6.19 -5.17 -1.00
Western Force -7.15 -6.41 -0.70
Fijian Drua -7.39 -7.98 0.60
Moana Pasifika -7.85 -11.25 3.40


Performance So Far

So far there have been 72 matches played, 51 of which were correctly predicted, a success rate of 70.8%.
Here are the predictions for last week’s games.

Game Date Score Prediction Correct
1 Crusaders vs. Highlanders May 23 15 – 12 17.10 TRUE
2 Reds vs. Hurricanes May 23 27 – 31 -3.60 TRUE
3 Chiefs vs. Moana Pasifika May 24 85 – 7 22.00 TRUE
4 Western Force vs. Waratahs May 24 17 – 22 3.30 FALSE


Predictions for the Quarter-finals

Here are the predictions for the Quarter-finals. The prediction is my estimated expected points difference with a positive margin being a win to the home team, and a negative margin a win to the away team.

Game Date Winner Prediction
1 Highlanders vs. Chiefs May 30 Chiefs -13.30
2 Brumbies vs. Crusaders May 30 Brumbies 0.80
3 Blues vs. Waratahs May 31 Blues 20.70
4 Hurricanes vs. Moana Pasifika May 31 Hurricanes 20.60
5 Reds vs. Fijian Drua May 31 Reds 12.50


NRL Predictions for Round 13

Team Ratings for Round 13

The basic method is described on my Department home page.
Here are the team ratings prior to this week’s games, along with the ratings at the start of the season.

Current Rating Rating at Season Start Difference
Storm 10.12 9.29 0.80
Panthers 5.47 8.50 -3.00
Roosters 5.33 7.44 -2.10
Sharks 4.93 5.10 -0.20
Sea Eagles 2.53 2.97 -0.40
Bulldogs 2.31 0.07 2.20
Cowboys 2.14 4.11 -2.00
Raiders 0.42 -3.61 4.00
Dolphins 0.17 -1.96 2.10
Broncos -0.78 -1.82 1.00
Warriors -0.88 -1.68 0.80
Knights -3.24 -0.05 -3.20
Dragons -3.79 -4.55 0.80
Rabbitohs -3.85 -4.35 0.50
Eels -4.27 -3.02 -1.30
Titans -7.28 -5.50 -1.80
Wests Tigers -9.33 -10.97 1.60


Performance So Far

So far there have been 93 matches played, 49 of which were correctly predicted, a success rate of 52.7%.
Here are the predictions for last week’s games.

Game Date Score Prediction Correct
1 Bulldogs vs. Dolphins May 22 8 – 44 8.50 FALSE
2 Eels vs. Sea Eagles May 23 30 – 10 -6.00 FALSE
3 Panthers vs. Knights May 24 6 – 25 11.20 FALSE
4 Roosters vs. Sharks May 24 42 – 16 1.30 TRUE
5 Warriors vs. Raiders May 25 10 – 16 3.10 FALSE


Predictions for Round 13

Here are the predictions for Round 13. The prediction is my estimated expected points difference with a positive margin being a win to the home team, and a negative margin a win to the away team.

Game Date Winner Prediction
1 Dragons vs. Knights May 30 Dragons 2.40
2 Titans vs. Storm May 31 Storm -14.40
3 Cowboys vs. Wests Tigers May 31 Cowboys 14.50
4 Sea Eagles vs. Broncos May 31 Sea Eagles 6.30
5 Rabbitohs vs. Warriors Jun 01 Rabbitohs 0.50
6 Panthers vs. Eels Jun 01 Panthers 9.70
7 Roosters vs. Raiders Jun 01 Roosters 7.90


AFL Predictions for Week 13

Team Ratings for Week 13

The basic method is described on my Department home page.
Here are the team ratings prior to this week’s games, along with the ratings at the start of the season.

Current Rating Rating at Season Start Difference
Western Bulldogs 22.28 18.20 4.10
Geelong Cats 19.87 15.04 4.80
Collingwood 19.03 5.39 13.60
Brisbane Lions 15.02 22.65 -7.60
Adelaide Crows 14.48 2.69 11.80
Hawthorn Hawks 13.62 21.95 -8.30
GWS Giants 8.51 9.08 -0.60
Fremantle Dockers 6.67 5.99 0.70
Gold Coast Suns 6.57 -6.41 13.00
Sydney Swans 3.10 12.60 -9.50
Carlton Blues 0.91 5.01 -4.10
Melbourne Demons -1.32 -0.21 -1.10
St Kilda Saints -5.58 0.89 -6.50
Port Adelaide Power -7.22 7.63 -14.90
Essendon Bombers -14.43 -10.15 -4.30
North Melbourne -27.96 -37.08 9.10
West Coast Eagles -32.23 -34.67 2.40
Richmond Tigers -33.70 -31.00 -2.70


Performance So Far

So far there have been 98 matches played, 61 of which were correctly predicted, a success rate of 62.2%.
Here are the predictions for last week’s games.

Game Date Score Prediction Correct
1 Geelong Cats vs. Western Bulldogs May 22 127 – 113 6.90 TRUE
2 Essendon Bombers vs. Richmond Tigers May 23 81 – 58 18.10 TRUE
3 Carlton Blues vs. GWS Giants May 24 82 – 110 8.50 FALSE
4 Hawthorn Hawks vs. Brisbane Lions May 24 60 – 93 16.20 FALSE
5 North Melbourne vs. Collingwood May 24 63 – 108 -47.60 TRUE
6 Fremantle Dockers vs. Port Adelaide Power May 24 100 – 51 20.80 TRUE
7 Adelaide Crows vs. West Coast Eagles May 25 128 – 62 55.10 TRUE
8 Melbourne Demons vs. Sydney Swans May 25 131 – 78 -0.50 FALSE
9 St Kilda Saints vs. Gold Coast Suns May 25 61 – 80 2.10 FALSE


Predictions for Week 13

Here are the predictions for Week 13. The prediction is my estimated expected points difference with a positive margin being a win to the home team, and a negative margin a win to the away team.

Game Date Winner Prediction
1 Brisbane Lions vs. Essendon Bombers May 29 Brisbane Lions 40.50
2 Collingwood vs. Hawthorn Hawks May 30 Collingwood 5.40
3 Gold Coast Suns vs. Fremantle Dockers May 31 Gold Coast Suns 10.90
4 GWS Giants vs. Richmond Tigers May 31 GWS Giants 53.20
5 Sydney Swans vs. Adelaide Crows May 31 Adelaide Crows -0.40
6 Melbourne Demons vs. St Kilda Saints Jun 01 Melbourne Demons 4.30
7 West Coast Eagles vs. Geelong Cats Jun 01 Geelong Cats -41.10


May 24, 2025

Redrawing a graph

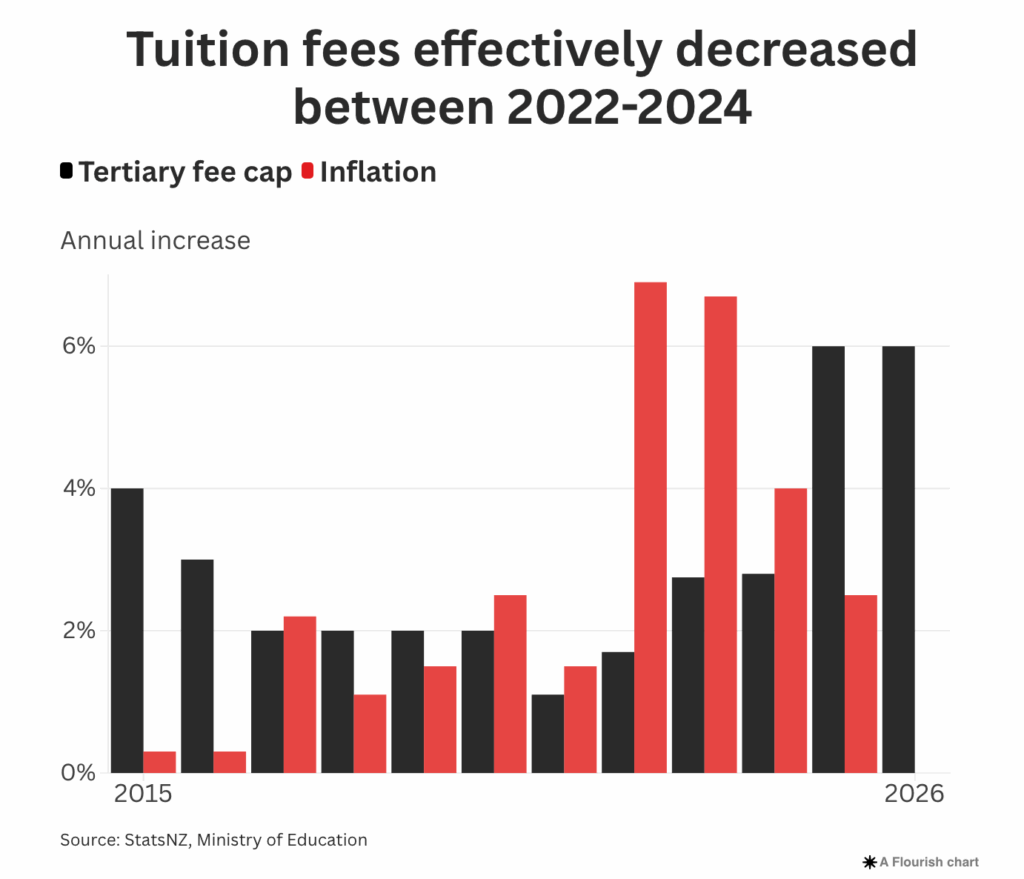
Newsroom has an article about tertiary funding in the new budget.  There’s a graph showing how the government fee cap and inflation have competed over the past few years. The graph in the article (ignoring the impact of a fee-free year) is

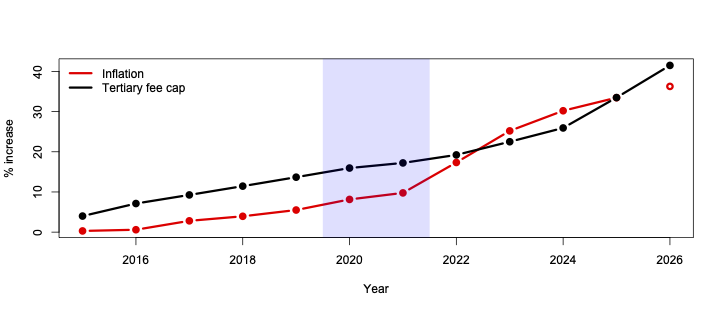
I find this a bit hard to interpret — it’s not easy to see the cumulative effect of the two changes and work out whether fees have shot ahead or lagged behind.  I think this is clearer, showing the cumulative effect of inflation and the (maximum) fee increase; the highlight is the two Covid border-closure years.

We can see that fees had increased in real terms but had now fallen behind inflation. Based (obviously) on a projection for 2026, fees might be slightly ahead again.

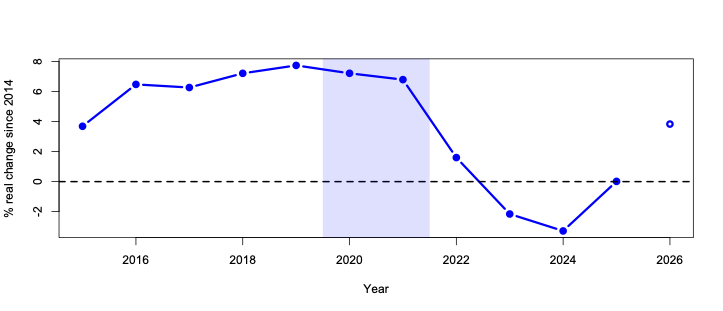
Another option is to use the inflation series to deflate the fee cap and just show the real-terms fee changes. Again, fees were up in real terms, then down, and are right at the 2014 level. Again, this ignores the impact of a fee-free year, which will depend on when one started uni.

What I think this shows is that adding up yearly changes (especially multiplicative ones) in your head is hard, and it’s probably harder than the opposite task of estimating changes in slopes.  If you need both scales, you might be better off with a cumulative graph.   The big disadvantage of a cumulative graph is that the visual impression can be quite sensitive to when you start adding.


May 20, 2025

How many coffees is a house?

RadioNZ have How many years would you have to skip coffee to save enough to buy a house?

The story correctly says (a) a lot, even if house prices didn’t go up, and (b) that’s not really the question.

There’s one point they miss  which is important to a lot of the narrative on house prices and saving (perhaps because this is a personal finance article, not a housing prices article).

The reason for housing unaffordability isn’t that Kiwis aren’t spending enough on housing.  You could imagine a world where housing was readily available and affordable, but people in general, or some group of people, couldn’t buy houses because they were spending all their money on beer and holidays and not saving anything for a deposit. In a world like that, advising people to save might be useful (if they listened).

That’s not the problem in New Zealand.  Kiwis, collectively, are spending far too much on housing. If one person gave up coffee or avocado toast  to save faster it might help them a little bit.  If we collectively gave up coffee and avocado toast to save faster, housing prices would just increase faster to compensate.

Golf, doctors, and Parkinson’s disease

Q: Did you see golf courses cause Parkinson’s Disease?

A: Maybe?

Q: Pesticides. In groundwater.  We should close down the Auckland golf courses!

A: Possibly, but for other reasons.

Q: Aren’t the pesticides bad?

A: There are some pesticides with reasonable links to Parkinson’s Disease, in particular paraquat (actually a herbicide) and organophospates. Most of the evidence in humans comes from farm workers, who get exposed to quite a lot of the stuff

Q: So these could explain the golf courses?

A: They could, but there are other differences between the people with and without Parkinson’s in the study, not just golf courses

Q: Some dude on Twitter said the cases were all near the Mayo Clinic and the controls were from all over

A: That sort of thing, but in fact the research paper includes an analysis with controls just from the same county as the cases, and the results aren’t all that different. It could still be that that the cases lived nearer the medical center; we can’t tell.

Q: So doctors cause Parkinson’s Disease?

A: More the reverse.  The researchers did make sure the cases lived in the right county at the time of diagnosis, but family history can matter, and the cases had seen a doctor more often in previous five years than the controls.  Also, doctors do cause diagnosis of Parkinson’s disease, which is what was measured.

Q: But it might be real?

A: Plausibly, yes.

Q: What about Auckland, then?

A: We get our water mostly from the Waitakeres and the Hunua ranges, which are not topographically suited to golf courses.  And most of the groundwater used in New Zealand is deep enough to be relatively safe.  And NZ is a bit fussier about what herbicides and pesticides we allow.

United Rugby Championship Predictions for the Quarter Finals

Team Ratings for the Quarter Finals

The basic method is described on my Department home page.
Here are the team ratings prior to this week’s games, along with the ratings at the start of the season.

Current Rating Rating at Season Start Difference
Leinster 14.28 12.09 2.20
Bulls 11.68 8.83 2.90
Stormers 6.72 6.75 -0.00
Glasgow 6.56 9.39 -2.80
Munster 4.58 9.28 -4.70
Sharks 3.47 -2.94 6.40
Edinburgh 3.13 0.09 3.00
Cheetahs 0.80 0.80 0.00
Scarlets -0.26 -10.65 10.40
Lions -1.37 6.73 -8.10
Connacht -1.88 -0.76 -1.10
Cardiff Rugby -2.01 -2.55 0.50
Ospreys -2.18 -2.51 0.30
Benetton -2.30 1.02 -3.30
Ulster -4.44 2.52 -7.00
Southern Kings -6.52 -6.52 0.00
Zebre -12.09 -16.17 4.10
Dragons -18.16 -15.41 -2.80


Performance So Far

So far there have been 144 matches played, 101 of which were correctly predicted, a success rate of 70.1%.
Here are the predictions for last week’s games.

Game Date Score Prediction Correct
1 Stormers vs. Cardiff Rugby May 17 34 – 24 15.40 TRUE
2 Edinburgh vs. Ulster May 17 47 – 17 10.30 TRUE
3 Munster vs. Benetton May 17 30 – 21 13.30 TRUE
4 Bulls vs. Dragons May 18 55 – 15 34.00 TRUE
5 Lions vs. Ospreys May 18 29 – 28 7.80 TRUE
6 Zebre vs. Connacht May 18 12 – 22 -3.20 TRUE
7 Sharks vs. Scarlets May 18 12 – 3 9.30 TRUE
8 Leinster vs. Glasgow May 18 13 – 5 14.70 TRUE


Predictions for the Quarter Finals

Here are the predictions for the Quarter Finals. The prediction is my estimated expected points difference with a positive margin being a win to the home team, and a negative margin a win to the away team.

Game Date Winner Prediction
1 Glasgow vs. Stormers May 31 Glasgow 8.10
2 Bulls vs. Edinburgh May 31 Bulls 14.20
3 Leinster vs. Scarlets Jun 01 Leinster 28.20
4 Sharks vs. Munster Jun 01 Munster -6.70


Top 14 Predictions for Round 25

Team Ratings for Round 25

The basic method is described on my Department home page.
Here are the team ratings prior to this week’s games, along with the ratings at the start of the season.

Current Rating Rating at Season Start Difference
Stade Toulousain 13.88 8.76 5.10
Toulon 4.74 5.32 -0.60
Bordeaux Begles 4.42 3.96 0.50
Stade Rochelais 2.06 4.85 -2.80
Clermont 1.52 0.41 1.10
Racing 92 1.05 2.75 -1.70
Montpellier 0.73 -0.96 1.70
Bayonne 0.46 -1.69 2.10
Castres Olympique 0.24 -0.09 0.30
Lyon 0.24 -0.18 0.40
Section Paloise -0.20 1.38 -1.60
Stade Francais -2.00 1.86 -3.90
USA Perpignan -4.05 -0.66 -3.40
Vannes -7.36 -10.00 2.60


Performance So Far

So far there have been 167 matches played, 126 of which were correctly predicted, a success rate of 75.4%.
Here are the predictions for last week’s games.

Game Date Score Prediction Correct
1 Bayonne vs. Vannes May 18 38 – 32 15.00 TRUE
2 Bordeaux Begles vs. Castres Olympique May 18 34 – 29 12.10 TRUE
3 Clermont vs. USA Perpignan May 18 31 – 13 10.10 TRUE
4 Section Paloise vs. Toulon May 18 25 – 21 2.90 TRUE
5 Stade Francais vs. Lyon May 18 31 – 30 4.00 TRUE
6 Stade Toulousain vs. Racing 92 May 18 35 – 37 20.00 FALSE
7 Stade Rochelais vs. Montpellier May 19 47 – 18 6.30 TRUE


Predictions for Round 25

Here are the predictions for Round 25. The prediction is my estimated expected points difference with a positive margin being a win to the home team, and a negative margin a win to the away team.

Game Date Winner Prediction
1 Castres Olympique vs. Bayonne Jun 01 Castres Olympique 5.30
2 Clermont vs. Stade Francais Jun 01 Clermont 9.10
3 Racing 92 vs. Montpellier Jun 01 Racing 92 8.00
4 Stade Rochelais vs. USA Perpignan Jun 01 Stade Rochelais 11.90
5 Stade Toulousain vs. Lyon Jun 01 Stade Toulousain 19.10
6 Toulon vs. Bordeaux Begles Jun 01 Toulon 6.00
7 Vannes vs. Section Paloise Jun 01 Section Paloise -1.00


Super Rugby Predictions for Week 15

Team Ratings for Week 15

The basic method is described on my Department home page.
Here are the team ratings prior to this week’s games, along with the ratings at the start of the season.

Current Rating Rating at Season Start Difference
Chiefs 12.35 11.43 0.90
Blues 10.53 14.92 -4.40
Crusaders 10.32 8.99 1.30
Hurricanes 9.21 10.97 -1.80
Brumbies 6.54 6.19 0.30
Reds 1.66 1.35 0.30
Highlanders -3.27 -2.50 -0.80
Moana Pasifika -6.10 -11.25 5.10
Waratahs -6.57 -5.17 -1.40
Western Force -6.77 -6.41 -0.40
Fijian Drua -7.39 -7.98 0.60


Performance So Far

So far there have been 68 matches played, 48 of which were correctly predicted, a success rate of 70.6%.
Here are the predictions for last week’s games.

Game Date Score Prediction Correct
1 Hurricanes vs. Highlanders May 16 24 – 20 17.10 TRUE
2 Waratahs vs. Crusaders May 16 33 – 48 -12.50 TRUE
3 Fijian Drua vs. Western Force May 17 38 – 7 0.70 TRUE
4 Moana Pasifika vs. Blues May 17 27 – 21 -14.70 FALSE
5 Brumbies vs. Reds May 17 24 – 14 8.10 TRUE


Predictions for Week 15

Here are the predictions for Week 15. The prediction is my estimated expected points difference with a positive margin being a win to the home team, and a negative margin a win to the away team.

Game Date Winner Prediction
1 Crusaders vs. Highlanders May 23 Crusaders 17.10
2 Reds vs. Hurricanes May 23 Hurricanes -3.60
3 Chiefs vs. Moana Pasifika May 24 Chiefs 22.00
4 Western Force vs. Waratahs May 24 Western Force 3.30