Twenty years on benefit?
The National Party is saying in ads “Stats show people under the age of 25 on Jobseeker Support will spend an average of 20 years on a benefit over their lifetimes.” That’s a surprising claim. Most surprising numerical claims in political advertising are true (though often misleading) and so we should expect this one to be true. It’s not so much that it might be misleading — I don’t think anyone will actually believe the natural interpretation of it — but it’s the sort of statement that (without context) is corrosive to the public confidence in statistics.
The natural interpretation is that people who go on Jobseeker Support while looking for a job under age 25 will spend an average of 20 years on unemployment benefits and similar. I don’t see how that could really be true. Lots of young people apply for Jobseeker Support while looking for jobs.
Let’s consider possibilities. One explanation would be that “on a benefit” is being interpreted to include, say, child support or pensions. In that case the claim might be true but uninteresting, and you might worry about attempts to change the statistics. Another possibility is that “Jobseeker Support” is a term with hidden complexities. A third is that there’s something happening with the calculation itself that is different from our expectations.
We need to find out what the actual “stats show”. This is trickier than it should be. Advertisers are required to have some support for certain sorts of claims, but they don’t have to make it easy to check. There’s nothing on the ads that I saw. There’s a story on Stuff that has expanded versions of the claims being made. In fact, there’s a substantially stronger claim
MSD analysis shows beneficiaries aged under 25 are projected to spend at least 20 of their working years on welfare
It doesn’t explain the implausible numbers, but it does at least provide links.
One of the links is to a page at MSD that gives some of the numbers
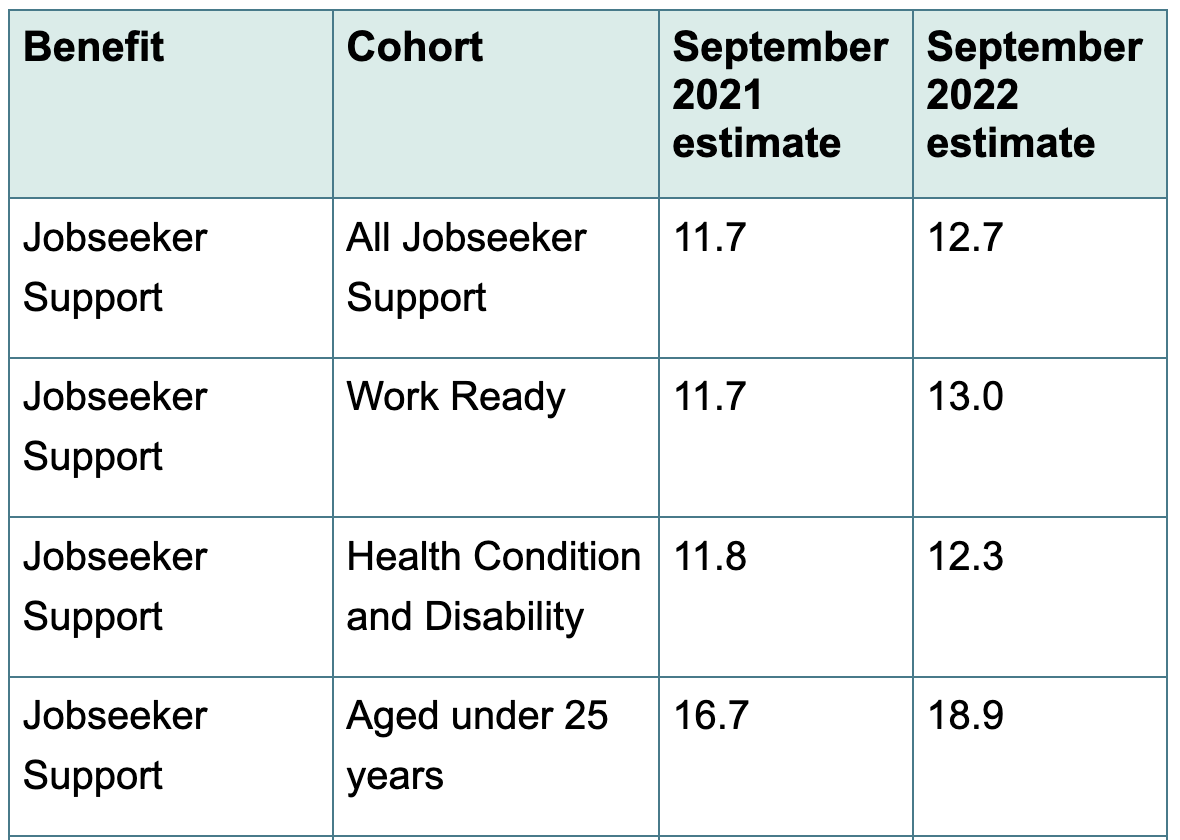
This table is useful. It makes two things clear. First, there are hidden complexities in the “Jobseeker Support” label — it also includes people unable to work for health or disability reasons. Second, and more surprising, this doesn’t help with the explanation. The “work ready” and “health condition and disability” subgroups have pretty much the same estimated years on benefit. The time is longer for young people, but that’s for the obvious reason that they have more time before age 65 available. The page also gives a list of what they count as “on a benefit”, confirming that they aren’t cheating by including things like retirement or child support.
Another link is to the underlying report (PDF). From this report, Table 3.1 is informative (click to embiggen)
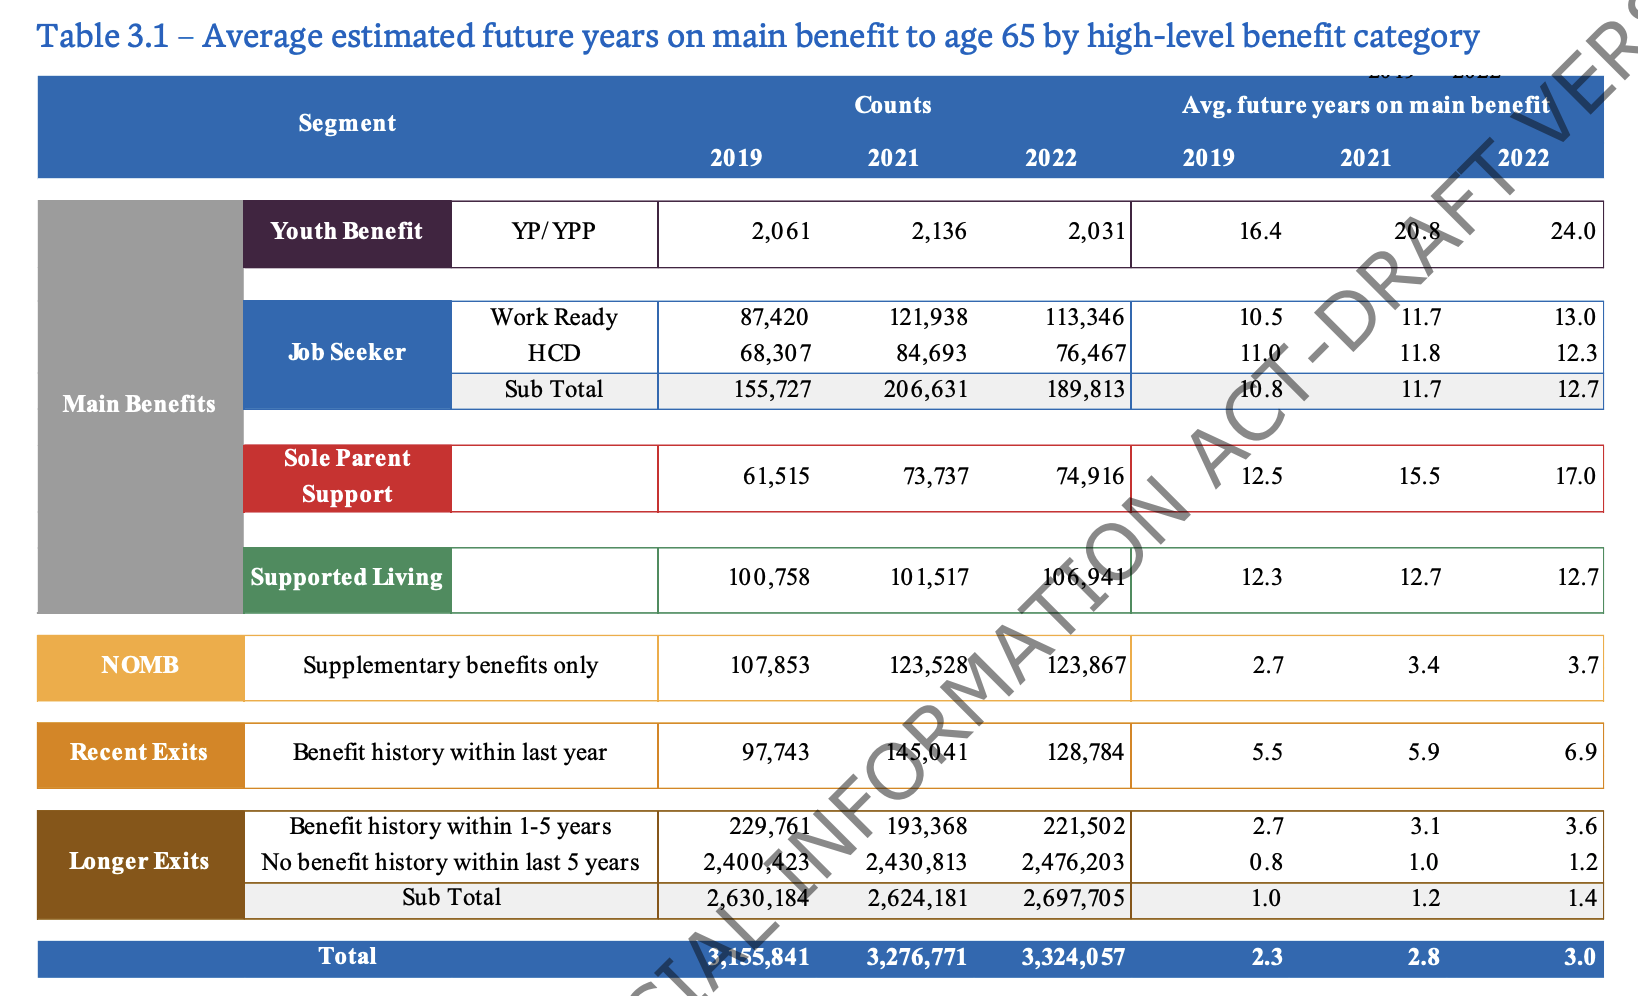
One important piece of information is the middle one of the brown-tagged rows: “Benefit history within last year”. This, together with the use of a modelling date of 30 September, and a table adding up to plausibly the NZ adult population, makes me think the denominator for the average time on a benefit is determined just by who is on a benefit on 30 September each year. If Chris finishes study in December, takes a month off, and starts looking for work in January, finding a job in June, they won’t be counted as “on a benefit under 25”. Using “on benefit at a particular date” as means your denominator will miss out on most people who have a short period of unemployment. In statistics, this is called “length-biased sampling”. We don’t mean “biased” in a negative way, necessarily, but sampling at a single date means you get more people with long eligibility periods and fewer people with short eligibility periods.
This, I think, is the context that makes the number more plausible. It’s not measuring people who start on a benefit when under 25, it’s measuring people who, at a particular point in time, are currently on a benefit. On top of that, the particular point in time is chosen to miss the short-term unemployment decrease each year as people leave full-time education. We can see that the length-biased sampling matters, because the group “Benefit history within last year” have about half the expected future time on benefits, and “Benefit history within 1-5 years” about another half lower.
With this in mind, the expected time on benefits in the future still probably does count as worryingly high. There’s no particular partisan side to concern about benefit traps — they are well recognised as a potential problem by progressives as well as conservatives. The policy questions are more about whether you should spend more money helping people get into jobs vs making it harder and more unpleasant to stay on benefit, and about what the appropriate income level of benefits should be.
I don’t feel the either the Ministry or the National Party have published these numbers in a way that makes the context easy to understand. I don’t think journalists have done a great job in explaining the numbers, either. In some ways the ads are the least worrying manifestation of these numbers, since no-one really expects a political ad to be fair and informative, but it would be nice if we could.
Thomas Lumley (@tslumley) is Professor of Biostatistics at the University of Auckland. His research interests include semiparametric models, survey sampling, statistical computing, foundations of statistics, and whatever methodological problems his medical collaborators come up with. He also blogs at Biased and Inefficient See all posts by Thomas Lumley »