The question matters
Luis Apiolaza has an interesting post on suicide statistics in Canterbury, where he examines the Coroner’s comments that suicide rates decreased after the quake.
He compares the actual counts of suicides since 2007 to a purely random sequence of counts with the same mean (a Poisson process), and doesn’t see much difference: one of the panels below shows the real data, and the other four show data with no pattern.
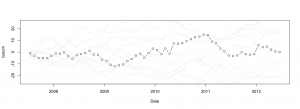
Another way to look at the same thing is with cumulative sums, used in industrial process control: the dots are cumulative sums of actual minus average suicides, and the dashed lines in the background are ten simulated versions of the same thing, with no true pattern. Again, the real data doesn’t stand out as different.
These analyses answer the question “Is there evidence of changes in suicide rate in Canterbury some time in the last five years?”, saying “Not really”. However, if we know when the February earthquake was, and we know that lower suicide rates (and also crime rates) are often seen after natural disasters, we can ask if the Canterbury data are consistent with that expectation. They are, as the Coroner observed, but if you didn’t already have that expectation, the data wouldn’t provide much evidence for it.
The data don’t speak for themselves: you have to ask them questions, and the choice of question matters.
Thomas Lumley (@tslumley) is Professor of Biostatistics at the University of Auckland. His research interests include semiparametric models, survey sampling, statistical computing, foundations of statistics, and whatever methodological problems his medical collaborators come up with. He also blogs at Biased and Inefficient See all posts by Thomas Lumley »


Hi Thomas,
Thanks for commenting on my post. You are right that the data are consistent with the expectation; however, one would need to be careful about making such expectation explicit. For example, one needs to assume that people did not consider the first quake (September 2010) as a substantial natural disaster (people in the Eastern suburbs may disagree) or that there was a lag to feel the effects.
As always there is a danger of coming up with general expectations a posteriori: that we modify our narrative to fit the observed data.
I see that you are coming to Canterbury later in the year. Hope to see you then down here.
12 years ago
Yes, you would need to at least assume that the first quake was substantially less of a natural disaster than the second one — though I suppose some cumulative effect also makes sense.
In any case, I liked your analysis, I just thought the problem was also a good illustration of how it matters what you’re looking for.
12 years ago
By the way, your cumulative sum graph is more elegant at making the point. Always learning…
12 years ago