November 10, 2015
Briefly
- One of the problems with reducing things to hypothesis testing is that you often don’t want to make a one-off decision. A comic from Saturday Morning Breakfast Cereal makes this point, but in a case where you really do want to make a one-off decision.
- From Stuff “Most women are either lesbian or bisexual’ but never straight, study claims”. From the Daily Beast: “Um, yes, straight women are real”
- Digit preference in US football “The only explanation that has stuck with me is that when a official thinks ‘oh damn this is a mess, there are seven separate six foot tall millionaires all piled up on top of the ball and I have 100 rules to try and remember, where did that ball stop?’ their subconscious makes them grab for the safety blanket of a line drawn and place it down on there.”
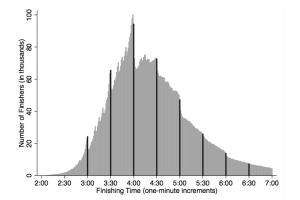
- Digit preference in marathons: People really prefer to run 3:59 rather than 4:00 (early last year, from some economists at Chicago(PDF), but you probably saw the New York Times version)

- Visualising persistence and change in Wikipedia entries, by Chris McDowall
- Canada can haz census again.
- A useful bit of arithmetic for “Why isn’t this medication free?” stories. Pharmac’s budget is a little under $800 million per year. There are about 4.5 million people in New Zealand, so that’s under $200 per person per year, or under $16,000 per person per expected lifetime. Based on more accurate inputs, it’s about $14,000 per person per lifetime.
- In the US, mortality isn’t falling for 45-54 year olds identifying as white the way it is for basically everyone else in the West. If you read lots of statistics blogs, you will have seen discussion about whether mortality in this group is really rising or not: the peak of the baby boom just swept through the 45-54 band, so the average age of people in this group has increased. That’s worth looking at, but doesn’t change the basic message.
- We’re used to interactive maps. The New York Times has a story about good and bad places to grow up that customises itself interactively for each US county.
Thomas Lumley (@tslumley) is Professor of Biostatistics at the University of Auckland. His research interests include semiparametric models, survey sampling, statistical computing, foundations of statistics, and whatever methodological problems his medical collaborators come up with. He also blogs at Biased and Inefficient See all posts by Thomas Lumley »
I said on Andrew Gelman’s blog that the graph seemed unbelieveable and was probably down to a change in definition of USW (US white) in 1998.
( http://andrewgelman.com/wp-content/uploads/2015/11/Screen-Shot-2015-11-05-at-7.53.11-PM.png )
I later found out that there was a change in racial defininitions in 1999 that increased the range of possible races and allowed for reporting multiple races. So that probably changed the count for the number of white people and thus the denominator for the mortality rate.
And at death, people probably defaulted to one race for someone not well known who had died and probably to white unless there was some other indication. So whiteness was probably over-counted i.e. screwing with the numerator in the mortality rate.
I know people have found that the 45-54 cohort had an increase in average age and that does explain some of the increase but I think the changing definitions of race is the real cause.
8 years ago