Posts from September 2011 (26)

September 30, 2011

Infographic: Laundry by family member

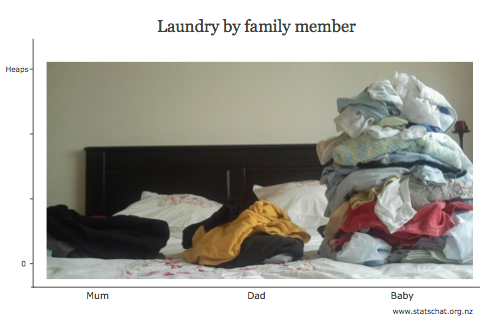
Data visualisation is difficult to do correctly, but this one just sort of fell out while I was sorting the family’s laundry:

Three stacks of laundry: Mum, Dad, Baby (gigantic)

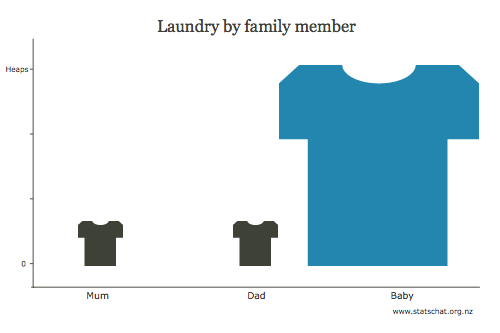
This sort of graphical representation is easy to do improperly, the most common offence being to scale on more than one axis, causing the area to confusingly increase at a much greater rate than the underlying data:

Three stacks of laundry, badly represented by a scaled picture

Here I demonstrate just one of many ways in which the graph can be manipulated to mislead the eye and thus the viewer.

Edward Tufte would still dislike my original graphic: there’s too much “chart junk” in the background. Move that pillow!

September 29, 2011

Will the All Blacks win the RWC? David Scott explains his predictions

In TV3 News on Tuesday, September 27, in a segment on predicting the 2011 Rugby World Cup, David Scott of the Department of Statistics at The University of Auckland gave a probability of 0.61 of the All Blacks winning the World Cup. Where did this come from?

He explains:

I did explain it a little more when talking to TV3 reporter Jane Luscombe, but essentially it was a quick and very dirty approximation to make the point that even if the All Blacks have a high probability of winning individual games, the chance of them actually winning the Cup can be disconcertingly low. Just that morning, the New Zealand Herald had reported that Graham Henry had won 84 out of 99 tests where he had coached the All Blacks, a success rate of 84.8%. To win the World Cup, the All Blacks must win three games in a row, and assuming independence that means a probability of 0.8483 = 0.61. If the probability of winning a game is as high as 90%, the probability of winning the Cup is still only 0.72, and if it is as low as 80%, then it is barely better than an even bet at 0.52.

There are reasons why the individual game probability should be higher than 84.8% and reasons why it should be lower. It should be lower because the 84/99 figure includes a lot of matches against lesser opposition than will be found in the finals of the World Cup, but higher because there is a home-ground advantage, particularly at Eden Park where the All Blacks have not lost since some time in the 1990s. If pressed I would probably say that the true probability is lower than 0.61, and may only be just above 0.5.

Tony Cooper’s calculations

Statistician Tony Cooper, of Auckland consultancy Double-Digit Numerics, has done an extensive analysis on his website.

Tony is even more downbeat on the chance of the All Blacks winning the World Cup, his probability being 0.478. He considers the likely opponents in each of the finals games and estimates the probabilities of winning the three games. First of all, he gives a rough calculation similar to mine above with probabilities of winning the three games to be 0.96, 0.58 and 0.70 giving a probability of 0.39 (All Blacks fans better prepare the sackcloth and ashes right now) …

I don’t think Tony is correct in some of his assumptions, however, and his determination of probabilities. Specifically he states:

“What about the home-game advantage? Should we increase the probability of New Zealand winning because they are playing at home? Probably. New Zealand has played better at home than away. But then you could argue that we should decrease the probability of New Zealand winning because they usually ‘choke’ at the Rubgy World Cup.

“It is difficult to asses these psychological changes in probabilities, so we remain more objective by ignoring them.”

I don’t think you can ignore the home-ground advantage. My analysis of the Super 15 and previous World Cups suggest a home ground advantage of 5 points. The same advantage appears to exist in the NRL.

My second criticism of Tony’s methodology is to question the relevance of some of his data. Yes, you can look at some thousands of past games, but surely most recent data is of more importance than data from 1987 or 1991? That is why I am a believer in exponential smoothing as a way of properly accounting for the relevance of the data.

Finally, there is the question of choking. There have been six Rugby World Cups so far, and New Zealand has won one. If the probability of winning is 0.478 then the All Blacks expect to win less than 3, compared to the 1 they have won, and the probability of winning one or less is still 0.131. If they win this year that will be 2 out of 7 with a p-value of 0.264. If they don’t win this year then the p-value will drop to 0.078. If the probability of winning a World Cup is 0.61, however, then the p-value given the current success rate of 1 out of 6 is only 0.037 which would provide evidence of inferior performance at World Cups.

At this time, I don’t think it is unreasonable to say that there is scant evidence that the All Blacks choke at World Cups: all we are seeing is the playing out of sensible probability calculations.

An alternative approach

My approach would be the one espoused by Stephen Clarke who is responsible for the method I have used for predicting results. Use the predicted game margins to estimate the probabilities of each team winning individual games. Use these probabilities to simulate the course of the Cup and the eventual winner, and determine the probability of winning by the proportion of wins over a large number of simulations.

The final word

The person on the street might be tempted to think this is a statistical version of the old joke about accountants. The dodgy accountant, when asked what is 1 plus 1, replies “What would you like it to be?” However, Tony and I agree on one thing: even if the All Blacks are the best team in the world and have high probabilities of beating other teams, the probability of them winning the World Cup is actually quite low.


Faster-than-light neutrinos.

So. It turns out that there is a statistical angle to the recent report of neutrinos travelling faster than light, since it’s the assessment of uncertainty in the travel time and distance that is really at issue.  For a nice summary of the measurement issues from a card-carrying physicist and popular science writer, see Chad Orzel’s blog.

September 28, 2011

Auckland air as dirty as New York?(updated 2x)

The Herald is reporting a WHO report that says the average levels of particulate air pollution are higher in Auckland than in New York.   The Environment Minister doesn’t believe it, and I tend to agree with him.

As the Green Party correctly points out, Auckland has far too many cars on the road.  But the same is true of New York, even though a larger fraction of their cars are taxis.  Auckland is surrounded by ocean, and the background levels of pollution in incoming air are very low.  New York is surrounded by a conurbation with a population of 21 million, nearly all of whom drive everywhere, and gets a substantial amount of pollution from the old coal-fired powerplants in the Ohio Valley.   Yes, the Northwestern Motorway is full of cars, but have you seen the Jersey Turnpike? (more…)

How and why to hire a data scientist

Or, as we would say, a statistician.

When you have too much data for Excel to handle: data scientists know how to deal with large data sets.

When your data visualization skills are being stretched: as we will see, data scientists are skilled (or should be) at data visualization and should be able to figure out a way to visualize most quantitative things that you can describe with words.

When you aren’t sure if something is noise or information: this is a big one, and we will come back to it.

Read the rest at  Mathbabe


September 27, 2011

Predicting Rugby World Cup and NRL victors – David Scott on TV3

This from TV3 news:

It’s not just rugby fans who are caught up in Cup fever.

An Auckland University professor has been predicting the results and so far he’s had an impressive success rate.

So does he think the All Blacks will win the World Cup? And how will the Warriors do in the NRL Grand Final on Sunday?

See the TV3 clip here.

September 26, 2011

Stat of the Week Winner: September 17-23

Thank you for the large number of nominations for last week’s Stat of the Week competition.

This week’s winning statistic was first nominated by Deepika Sulekh:

Women who eat low-fat yoghurt while pregnant increase their chances of having children who develop asthma and hay fever.

Daily yoghurt consumption raised the odds 1.6 times of giving birth to a child who suffered from asthma by the age of seven.

We plan to write up some thoughts on this study once the paper is published and we’ve had a read. In the meantime read this blog post over at Junk Science.

(Special mention must go to Natalie’s comments about the “one in 3200 chance of the space junk hitting SOMEONE”.)

Stat of the Week Competition: September 24-30

Each week, we would like to invite readers of Stats Chat to submit nominations for our Stat of the Week competition and be in with the chance to win an iTunes voucher.

Here’s how it works:

  • Anyone may add a comment on this post to nominate their Stat of the Week candidate before midday Friday September 30 2011.
  • Statistics can be bad, exemplary or fascinating.
  • The statistic must be in the NZ media during the period of September 24-30 2011 inclusive.
  • Quote the statistic, when and where it was published and tell us why it should be our Stat of the Week.

Next Monday at midday we’ll announce the winner of this week’s Stat of the Week competition, and start a new one.

The fine print:

  • Judging will be conducted by the blog moderator in liaison with staff at the Department of Statistics, The University of Auckland.
  • The judges’ decision will be final.
  • The judges can decide not to award a prize if they do not believe a suitable statistic has been posted in the preceeding week.
  • Only the first nomination of any individual example of a statistic used in the NZ media will qualify for the competition.
  • Employees (other than student employees) of the Statistics department at the University of Auckland are not eligible to win.
  • The person posting the winning entry will receive a $20 iTunes voucher.
  • The blog moderator will contact the winner via their notified email address and advise the details of the $20 iTunes voucher to that same email address.
  • The competition will commence Monday 8 August 2011 and continue until cancellation is notified on the blog.
September 22, 2011

Harder to win big in the lottery

The ‘Big Wednesday’ lottery has moved from 6 balls out of 45 to 6 balls out of 50, which reduces even further the chance of getting the division 1 prize.  To win division 1, you need 6 balls correct out of 6, plus a correct coin toss.  There are 8,145,060 ways to choose 6 balls out of 45, and about twice as many ways, 15,890,700, to choose 6 balls out of 50.  Adding in the coin toss halves the chance of winning: the chance of winning per ‘line’ used to be 1 in 16,290,120 and is now 1 in 31,781,400.   For a minimum $4 ticket, which gives 4 ‘lines’, the chance of a division 1 prize was 1 in 4,072,530 and is now 1 in 7,945,350.

One back-of-the-envelope way to get roughly the correct impact of the change is to note that the chance of matching a given ball has gone down about 10%: from 1/45 to 1/50.  Multiplying 90% by itself six times says that the chance of winning is 53% of what it was, a very good approximation to the actual ratio, which is 51%.  The Dominion Post had the correct change, but the computations they report seem to have the effect of the coin toss backwards, so all their probabilities are overly optimistic by a factor of four.

Of course, the other way to look at it is that your chance of not winning division 1 with a $4 ticket has gone from 99.99998% to 99.99999%. Hardly seems worth mentioning. (more…)

Death by toaster or death by terrorism?

Which do you think is more likely to kill you? A toaster or Islamic extremist terrorism? The answer may surprise you.

Security guru Bruce Schneier has written a piece entitled Terrorism in the U.S. Since 9/11. As a critic of the excesses of the United States of America’s response to the events of September 11, 2001, Schneier compares the spending on anti-terrorism with the number of lives saved.

In my opinion, the most interesting part was where he refers to a Comparison of Annual Fatality Risks published deep inside Hardly Existential: Terrorism as a Hazard to Human Life by John Mueller and Mark G. Stewart:

You have a 1 in 1,500,000 chance of being killed by a home appliance every year in the United States, but only a 1 in 3,500,000 chance of being killed by terrorism.