Posts from November 2011 (34)

November 10, 2011

Non-amazing twin coincidence (updated)

Stuff is reporting, in their Oddstuff section, a story about twins who will turn 11 tomorrow, 11-11-11.  How odd is this?

There are about 64000 births per year in New Zealand, or about 175 per day.  The rate of twin births is somewhere between 1 in 60 and 1 in 100, so on an average day, such as 11-11-00, there will be about two pairs of twins born.  So we’d expect two pairs of Kiwi twins to turn 11 on 11-11-11. You might wonder what the other pair was doing.

If you read the story, though, you see it’s actually from the United States: Madison, Wisconsin.  There were more than 50,000 pairs of  twins born in the US in 2000, so we’d expect about 136 pairs turning 11 tomorrow.

There must be lots of community papers across the world reporting on a pair of local twins turning 11 tomorrow.  The interesting question  is how the Overman twins got their story on to the Associated Press wire and into 181 (and counting) newspapers around the world, and how the same mechanisms are used on stories that aren’t just harmless fluff.

Updated:  Now there’s a local pair of twins, one of  whom is quoted as saying “There are probably only one or two [sets of twins] in the world turning 11 on that date.” 

Updated again: You’d expect there to be several sets of birthday triplets out there somewhere in the industrialized world, and one set have shown up in Windsor (Canada). Unfortunately, the story also spends a lot of time with Uri Geller, trying to get Deep Significance out of the date.

November 9, 2011

What the frack?

The New Zealand Herald (09-Nov-2011) has a very interesting article about earthquakes in Oklahoma. Scientists from the Oklahoma Geological Survey plan to investigate whether the process of “fracking” has led to an increase in earthquake activity.

Fracking is a controversial fossil fuel recovery method whereby high pressure water is injected into rock, fracturing it, and then send is forced into the cracks allowing the substance of interest, in this case gas, to escape. This process has been known about for quite sometime, but it is the depletion of existing reserves, and the subsequent increase in the price of oil and gas that has made it exceptionally popular in recent times.

In Oklahoma, the principal fracking area is known as the Devonian Woodford Shale. According to Wikipedia, the first gas production was recorded in 1939, and by late 2004, there were only 24 Woodford Shale gas wells. However, by early 2008, there were more than 750 Woodford gas wells. Another site reports that currently over 1,500 wells have already been drilled with many more to come. The wells cost $US2-3 million, and there are more than 35,000 shale gas wells currently in the United States.

One of the nice things about the US Geological Survey, and its state based constituents, is that it is usually relatively easy to get data from them. I say relatively, because it required some searching and programming to speed the process up, but the data is all there for someone willing to spend sometime getting it.

To show fracking is causing an increase in seismic activity would require proper experimentation. However, it may be possible to show correlation at least between the increase in fracking wells and the number of seismic events. I don’t have enough clout, or time, to extract the information about the number of wells, and their location. However it is still interesting just to take a look at the data we can get regarding the number of earthquakes ourselves.

Time series plot of earthquakes in Oklahoma

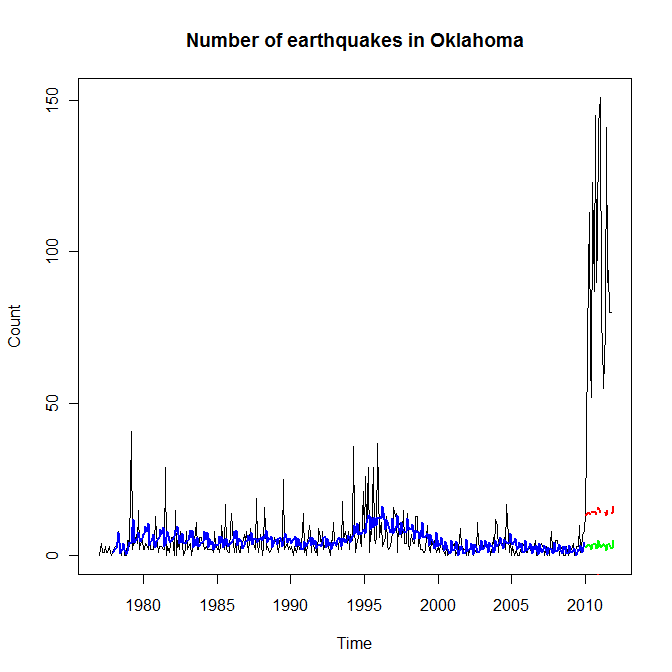
The black line in time series plot above shows the number of seismic events from January 1977 to October 2011. The rise at the start of 2010 is certainty indisputable. The blue line a form of exponential smoothing called Holt-Winters smoothing (or Holt-Winters triple exponential smoothing). It is a simple statistical technique that attempts to model the trends (among other things) in time series data. The green line is the predicted number of earthquakes using this smoothing model (calculated on the pre-2010 data) for the time period starting January 2010 to October 2011, and the red line is the upper confidence limit on this prediction. This is a very simple modelling attempt, and undoubtedly the “real time-series analysts” could do better (and here is the data for you), but what I would like to think this shows is that the increase in quake count is so far off the charts that it definitely qualifies for further investigation.

Some of you will no doubt be grumbling that I have not accounted for the magnitude, or depth, or location, or in fact many other things, and indeed I have not. However, I do think the data is interesting, and the association with the increase in fracking should be explored further – which is what the Oklahoma Geological Survey plans to do.

I have made the uncleaned raw data available here.

November 8, 2011

Political poll with sample size of 47 makes headlines

David Farrar of Kiwi Blog criticises a story in the Herald which says:

John Banks has some support in the wealthy suburb of Remuera, but is less popular on the liberal fringes of the Epsom electorate, according to a Herald street survey.

A poll of 47 Epsom voters yesterday found the National candidate ahead of Act’s Mr Banks by 22 votes to 20.

Farrar correctly points out that the poll is in no way random (i.e. is not scientific), and goes on to say:

But even if you overlook the fact it is a street poll, the sample size is ridiculously low. The margin of error is 14.7%! I generally regard 300 as the minimum acceptable for an electorate poll. That gives a 5.8% margin of error. A sample of 47 is close to useless.

November 7, 2011

Stat of the Week Winner: October 29-November 4 2011

Thanks for all the nominations for last week’s Stat of the Week competition.

We’ve awarded Cam Slater’s nomination as the winner, with runner up going to John Kerr’s nomination.

MV Rena oil graphic

Articles about the MV Rena appeared in the New Zealand Herald over the past week and I’m surprised they didn’t show up in the Stat of the Week competition.

Let’s take a look at one in particular, from October 31. See that graphic there? Cam Slater didn’t like the manipulated Likert-scale, but I was more concerned by the thermometer:

It raises more questions than it answers, and even after several minutes staring at it and trying to decipher it, I was even more bewildered. The areas are overlapping, there’s a giant bulb on the bottom hiding where 0 belongs, and the different colours and sizes drag the eye around in a mad series of saccades.

I took it upon myself to redo this into something a bit tidier and less confusing. Is it better? I’ll let you be the judge of that:

Stat of the Week Competition: November 5 – 11, 2011

Each week, we would like to invite readers of Stats Chat to submit nominations for our Stat of the Week competition and be in with the chance to win an iTunes voucher.

Here’s how it works:

  • Anyone may add a comment on this post to nominate their Stat of the Week candidate before midday Friday November 11 2011.
  • Statistics can be bad, exemplary or fascinating.
  • The statistic must be in the NZ media during the period of November 5-11 2011 inclusive.
  • Quote the statistic, when and where it was published and tell us why it should be our Stat of the Week.

Next Monday at midday we’ll announce the winner of this week’s Stat of the Week competition, and start a new one.

The fine print:

  • Judging will be conducted by the blog moderator in liaison with staff at the Department of Statistics, The University of Auckland.
  • The judges’ decision will be final.
  • The judges can decide not to award a prize if they do not believe a suitable statistic has been posted in the preceeding week.
  • Only the first nomination of any individual example of a statistic used in the NZ media will qualify for the competition.
  • Employees (other than student employees) of the Statistics department at the University of Auckland are not eligible to win.
  • The person posting the winning entry will receive a $20 iTunes voucher.
  • The blog moderator will contact the winner via their notified email address and advise the details of the $20 iTunes voucher to that same email address.
  • The competition will commence Monday 8 August 2011 and continue until cancellation is notified on the blog.

Stat of the Week Nominations: November 5 – 11, 2011

If you’d like to comment on or debate any of this week’s Stat of the Week nominations, please do so below!

November 4, 2011

Election polls: filling in the blank

It’s a familiar phenomenon that a party leader can be more popular, or less popular, than the party they represent. For example, Labour is currently more popular than Phil Goff.

The problem is especially difficult to handle in the US elections. At the moment, we pretty much know that Barack Obama will be the Democrats’ presidential candidate next year.  We don’t know who the Republicans will pick.  You could run a poll asking “Would you vote for Obama or for a Republican opponent”, or you could pick one of the current candidates for the Republican nomination and ask “Obama vs Cain” or “Obama vs Romney”.  It turns out to matter.

In the current polls, President Obama loses to Generic Republic Opponent by about 3%, but beats everyone in the current Republican field. The only actual Republican who comes close in current support to Fill In The Blank is Mitt Romney, who is about 2% behind Obama.    We’ll have to wait until February to see what happens when the Republican nominee is chosen.


Data Science a sport? – a very profitable one

From the Sydney Morning Herald, Making Statistics a Sport

Every 46 seconds.

A full page advertisement in today’s New Zealand Herald proclaims:

Every 46 seconds a Kiwi is rewarded by Fly Buys

I, for one, am not impressed.