Posts from January 2013 (48)

January 21, 2013

Journalist on science journalism

From Columbia Journalism Review (via Tony Cooper), a good long piece on science journalism by David H. Freedman (whom Google seems to confuse with statistician David A. Freedman)

What is a science journalist’s responsibility to openly question findings from highly credentialed scientists and trusted journals? There can only be one answer: The responsibility is large, and it clearly has been neglected. It’s not nearly enough to include in news reports the few mild qualifications attached to any study (“the study wasn’t large,” “the effect was modest,” “some subjects withdrew from the study partway through it”). Readers ought to be alerted, as a matter of course, to the fact that wrongness is embedded in the entire research system, and that few medical research findings ought to be considered completely reliable, regardless of the type of study, who conducted it, where it was published, or who says it’s a good study.

Worse still, health journalists are taking advantage of the wrongness problem. Presented with a range of conflicting findings for almost any interesting question, reporters are free to pick those that back up their preferred thesis—typically the exciting, controversial idea that their editors are counting on. When a reporter, for whatever reasons, wants to demonstrate that a particular type of diet works better than others—or that diets never work—there is a wealth of studies that will back him or her up, never mind all those other studies that have found exactly the opposite (or the studies can be mentioned, then explained away as “flawed”). For “balance,” just throw in a quote or two from a scientist whose opinion strays a bit from the thesis, then drown those quotes out with supportive quotes and more study findings.

I think the author is unduly negative about medical science — part of the problem is that published claims of associations are expected to have a fairly high false positive rate, and there’s not necessarily anything wrong with that as long as everyone understand the situation.  Lowering the false positive rate would either require much higher sample sizes or a much higher false  negative rate, and the coordination problems needed to get a sample size that will make the error rate low are prohibitive in most settings (with phase III clinical trials and modern genome-wide association studies as two partial exceptions).    It’s still true that most interesting or controversial findings about nutrition are wrong, and that journalists should know they are mostly wrong, and should write as if they know this.   Not reprinting Daily Mail stories would probably help, too.
 

January 20, 2013

Crime trends and marriage equality

[Update: according to today’s Herald, Mr McVicar wasn’t speaking for the Sensible Sentencing Trust.  That wasn’t clear from yesterday’s story.]

The Sensible Sentencing Trust, rather surprisingly given their goals, seem to have a view on same-sex marriage. As Stuff reports

Sensible Sentencing Trust leader Garth McVicar has submitted to Parliament that changing the law to allow same-sex marriage will be yet another erosion of basic morals and values in society which have led to an escalation of child abuse, domestic violence, and an ever-increasing prison population.

The story also quotes someone who knows what they are talking about

Criminologist Dr James Oleson, from Auckland University, an expert in deviance, said he was not familiar with any research that would suggest homosexuals would be responsible for a disproportionate amount of crime.

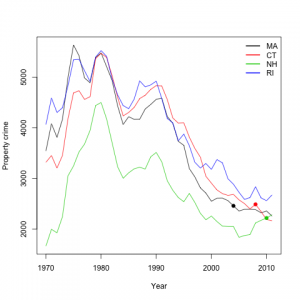
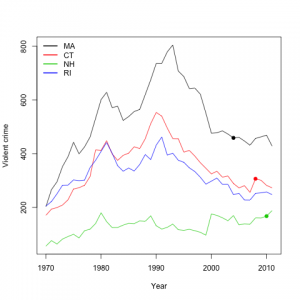
I thought it would be entertaining to look at data from the US, where several states have introduced marriage equality over the past several years.  I looked at states bordering Massachusetts, since it was the first, in 2004, Connecticut and New Hampshire followed a few years later.  Here are graphs of crimes per 100,000 population for these three states and for Rhode Island, which does not yet allow same-sex marriage.

First, violent crime.  The dot is the year that same-sex marriage started.

violent-crime


And property crime

prop-crime

See the upward trend after the dots? Me either.

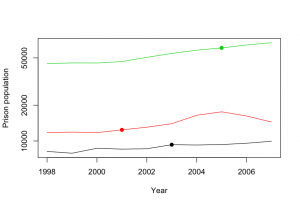
For Europe it was harder to find crime data, but Mr McVicar mentioned “an ever-increasing prison population”, and I did find 1998-2007 prison populations for European Union countries.  Here are the trends for the three that introduced same-sex marriage during that period: Netherlands (red), Belgium (black), and Spain (green).  Again, the dots are when marriage equality started. Looking at this graph, the phrase “robustly null” comes to mind.

europrison


I don’t know why Mr McVicar thinks he and other New Zealanders will lose their moral fibre and become hardened criminals if the marriage equality bill passes, but it doesn’t seem to have happened in other countries.


January 17, 2013

Melanoma apps

Stuff has a good story about a research study looking at smartphone apps for diagnosing melanoma.  These turn out not to be very accurate: they miss quite a lot of melanomas. The story doesn’t mention the false positives, but they are just as bad. Three of the four apps reported  more than 60% of non-melanomas as of concern, so you might as well just cut out the middleman and get checked properly from the start.

Nitpicking: the study was done at the University of Pittsburgh, which is in Pittsburgh, not in Chicago as Stuff seems to think.  Also, the name of the journal isn’t “Online First”, it’s JAMA Dermatology.

Up-Goer Five biostatistics edition

Inspired by the XKCD cartoon describing the Saturn V rocket (US Space Team’s Up Goer Five) using only the 1000 most common words in English, people are now writing descriptions of their jobs.   Here’s mine:

I work with doctors who study how to avoid people being sick, especially in their hearts. It is easy to confuse different reasons for being sick, and I use numbers to help the doctors understand if the real cause is what they guess. I also study how to decide what numbers to get and from how many people, so that we can be sure, but not use too much money or time. I need to use a computer because there are lots of numbers to study, and I write stuff so the computer can help other people plan and use numbers to find things out. 

Also, there are lots of cool jobs for people who use numbers to help people find things out, so lots of students want to learn how. At my school, we (try to) help them learn.

This description has been brought to you by “the year for people all over the world to talk about using numbers to find things out”.

[Update: there’s a Storify list of these taken from Twitter. We’re on it thanks to Brendon’s tweet]

Think of a number and multiply by four.

The ACC gives people money, and so has to balance the risks of fraud, rejection of valid claims, and red tape.  We get a lot of stories claiming that ACC isn’t paying people it should pay, but today’s story is about the cost of fraud.

The cost is variously described as

  • $10 million (over four years)
  • $1.8 million-$3.5 million (per year)
  • $35.9 million (actuarial cost)
  • $131 million (total future cost if it isn’t stopped)

The $131 million and $10 million numbers don’t have much going for them.  There’s no particular reason to give a total over four years; an average of $2.5 million/year would have been more helpful.  The $131 million includes costs into the indefinite future, but makes them look as if they are just like costs incurred now.  That’s the point of the actuarial estimate, to say something sensible about the current equivalent value of future expenses.

By an interesting coincidence, the $131 million figure exceeds the actuarial estimate by about the same ratio as the headline total exceeds the annual average.

Briefly

  • An illustration of what happens to promising new medical treatments: the first randomized trial of fish oil found a 70% reduction in rate of deaths, though the study was too small to be reliable.  After the second study, the estimate was down to 20%.  It’s now 4%, with a margin-of-error of 6%. 
  • A Wall Street Journal infographic that’s doing the rounds, on the impact of the ‘fiscal cliff’.  Includes a representative solo mother with two children, who faces a $3300 tax increase. On her income of US$260,000.  The median household income for families with female householder and no husband is US$32978 (that also includes a subset of the unmarried couples with children, but there’s fewer of them in the US than here).
  • Roger Peng writes about the Beijing air pollution. It is indeed ‘crazy bad’, but the Great London Fog was substantially worse.  Similarly, when you read about developing-country water pollution, remember that the Cuyahoga River, in Cleveland, caught fire several times.
January 15, 2013

Cannabis, teenagers, and poverty

You may have heard some under-rehearsed radio wittering from me on this topic, so I thought I should write something more coherent.

Last August, researchers from the Dunedin Cohort Study published a paper showing that people who had been heavy cannabis users as teenagers performed worse on cognitive function tests later in life, where this wasn’t true of people who started using cannabis as adults. One natural interpretation of these associations is that cannabis has toxic effects during brain development.  As I pointed out at the time, the evidence isn’t overwhelming (since it’s a relatively small study and we know environmental factors can lead to differences as big as those observed) but was somewhat persuasive and is probably better than other studies on this topic.

Now, a Norwegian economist has argued that the results could be explained by purely sociological factors: that people from low-socioeconomic status backgrounds are more likely to use cannabis, and to perform worse on cognitive function tests, and that the difference in cognitive function tests tends to increase over time after school.  He is correct; this could explain the published results.  However, the Dunedin Cohort Study researchers have done further analyses in response, and while the socioeconomic explanation was reasonable, it seems to not be true.  Both the relationship between socioeconomic status and cannabis use, and the relationship between low socioeconomic status and change over time in cognitive function test results were weak in this particular data set.

Even if the association is real and causal there could still be explanations that don’t involve brain toxicity.  For example, imagine that people who enjoy being stoned are less likely to choose jobs and recreational activities that are cognitively demanding.  They would then to some extent tend to end up scoring lower on cognitive function tests in later life.  This, if it were true, would be an explanation that does depend on the properties of cannabis, but not on toxic effects.

Over all, this result doesn’t have huge implications for drug policy.  It doesn’t change the basic fact that cannabis is far from innocuous but is also much safer than alcohol or tobacco.  It doesn’t affect the relevant international treaties and probably won’t shift domestic public opinion.  Differences of opinion on cannabis policy questions depend mostly on different preferences, and partly on other uncertainties. For example, would legal cannabis lead to more or less alcohol consumption?

I’d recommend the book “Marijuana legalization: what everyone needs to know”.  This is written by a group of public-policy academics, who have varying policy preferences, but looked at what evidence they could agree on. It gives a series of questions and what is known about their answers. Unfortunately it’s not (yet?) in the Auckland city library.

Links: Stuff, Science Media Centre


January 14, 2013

20% of what?

The stories about the 20% cut in prices for international bandwidth from Southern Cross would be a lot more informative if they included some idea of how much it costs before and after, or, even better, roughly what fraction of the consumer price goes to international bandwidth.  Even to the nearest 20% would be nice.

Otherwise we’re not getting much value added over the press release.

More about Lotto numbers …

From today’s New Zealand Herald:

Five Lotto numbers prove very lucky

Two Saturdays in a row, five of the same numbers were drawn in Lotto.

But a statistician says the chances of that happening aren’t as high as they may seem – 1 in 5500 ….

Said statistician is our very own Russell Millar. The rest of the story is here


January 13, 2013

Fascinating research into the placebo effect

Harvard Magazine has an article on Ted Kaptchuk’s research into how (not if) the placebo effect works. From a new clinical trial, his team has found that the methods of placebo administration are as important as the administration itself:

“It’s valuable insight for any caregiver: patients’ perceptions matter, and the ways physicians frame perceptions can have significant effects on their patients’ health.”

Read more »