Posts from January 2013 (48)

January 24, 2013

Enough with the Nobel correlations, already

Remember the correlation between current chocolate consumption and all-time Nobel Prizes?

Two British researchers now have done the same exercise for current milk consumption. Their letter, in the journal Practical Neurology suggests (I hope not seriously) that vitamin D might be responsible. They used Messerli’s data on Nobel Prizes, and don’t seem to have noticed any of the problems with it.

As you will remember, we showed length of country name (per capita) was rather more strongly correlated with Nobel Prizes (per capita) than chocolate consumption, and it also beats milk consumption. It’s also much more convincing as a causal relationship: the country names are much more constant over the time the Nobel Prize data were accumulated than milk or chocolate consumption, and since there’s no plausible mechanism for wealthy countries to have longer names than poor countries we avoid economic confounding.


Rare disease dilemma

The Herald has a story about a new treatment for a very rare blood disorder, and the fact that Pharmac isn’t funding it.

The drug, eculizumab (brand name Soliris), is currently the world’s most expensive, at about NZ$500 000 per year. It’s also very effective.  There’s starting to be a lot of this: we now have the technology to develop specific treatments for a wider range of rare diseases, and most of the rest of that ‘most expensive’ list are replacement enzymes for rare deficiency disorders.   Another recent example is ivacaftor (brand name Kalydeco), which, in about 5% of cases of cystic fibrosis allows the defective chloride transporter protein to work normally.  The result appears to be complete control of the disease, but at a cost of US$300 000 per year. Similar drugs for other variants of cystic fibrosis are being tested.

Funding any one of these drugs would be a minor total cost for Pharmac, because each rare disease is rare. There are only about eight people in New Zealand who would take eculizumab, which would cost only 0.5% of Pharmac’s budget; there would be about 25 who could take ivacaftor, adding up to a percent or two of the budget. The difficulty is that rare diseases collectively are not rare — the European Organization for Rare Diseases estimates that 6-8% of the European Union population have a rare disease and applying that figure to the NZ population still gives 270 000 people.  At $500 000 per person, Pharmac’s total budget would pay for 1500 people to get this sort of very expensive treatment.  At the moment there probably aren’t 1500 people in NZ whose rare diseases are expensively treatable, but there are a lot more than eight.

The patient support group for people with this rare blood disorder obviously think the treatment should be funded

The group’s founder, Auckland artist Daniel Webby, 32 – who almost died from PNH complications – said the funding process did not recognise the rights of rare-disease sufferers.

“They need to recognise that for rare diseases, [drug] development costs are higher per patient. They need to put that into their budget and make sure people get … life-saving treatments when they are available.”

I’m sure Pharmac does recognise this, but changing the national approach to subsidy of health care to give priority to ‘miracle’ treatments for rare diseases is not the sort of decision Pharmac should be making on its own, and the money shouldn’t be taken out of the current Pharmac budget (which is already on the low side).   Kiwis need to decide whether a miracle drug fund is something we want to support and are willing to pay for.


[Update: The Herald has an editorial weighing in strongly against expensive drugs even if effective.  I basically agree, but it’s a pity they don’t have the same attitude to miracle treatments that don’t work]

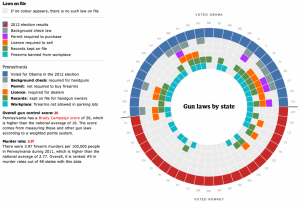
January 23, 2013

Bad graphs

A few resources for connoisseurs of bad graphics

But remember, as Martyn Plummer demonstrates, the graph may not be the author’s fault.

PS: we get a surprising number of readers searching for “cool excel graphics”, which is an excellent resource for bad graphs

Statistical evidence and cheating at chess

At the Zadar Open chess competition last month, a player who had previously been at the low end of the chess master range did extraordinarily well, playing the level of the world’s very best. Or at the level of a good computer program. There was absolutely no physical evidence to suggest that he had been cheating, but his level of improvement, and the agreement between his moves and those produced by top computer programs are striking.  On the other hand, if you are going to allow accusations in the absence of any corroborating physical evidence, it’s also essentially impossible for an innocent person to mount a defense.

KW Regan, who is a computer scientist and chess master has analysed historical chess competition data, looking at agreement between actual moves and those the computer would recommend, and he claims the Zadar Open results should happen less often than once in a million matches. In his letter to the Association of Chess Professionals, he raises the questions

1.What procedures should be instituted for carrying out statistical tests for cheating with computers at chess and for disseminating their results? Under whose jurisdiction should they be maintained?
2. How should the results of such tests be valued? Under what conditions can they be regarded as primary evidence? What standards should there be for informing di fferent stages of both investigative and judicial processes?

There’s a New York Times story, and Prof Regan also has a blog post. (via)

Where denominators don’t help

There’s a report saying that NZ smartphone users are the 7th most at risk for attacks by cybercriminals.  We could ask the usual questions about whether this survey is worth the paper it’s not written on, but this time those are left as an exercise for the reader [as is often the case, the last sentence of the Herald’s story is especially informative].

An unusual problem with the ranking is

The ranking was based on the percentage of Android apps rated as high-risk over the total number of apps scanned per country.

The use of a percentage rather than a total here seems to make no sense.  If you have a high-risk app on your phone, it doesn’t become low-risk just because you also have lots of other apps.

Biologists want more statistics

An article in Nature (not free access, unfortunately) by Australian molecular biologist David L. Vaux

 “Experimental biologists, their reviewers and their publishers must grasp basic statistics, or sloppy science will continue to grow.”

This doesn’t come as a surprise to statisticians, but it is nice to get the support from the biology side.  His recommendations are also familiar and welcome

How can the understanding and use of elementary statistics be improved? Young researchers need to be taught the practicalities of using statistics at the point at which they obtain the results of their very first experiments.

[Journals] should refuse to publish papers that contain fundamental errors, and readily publish corrections for published papers that fall short. This requires engaging reviewers who are statistically literate and editors who can verify the process. Numerical data should be made available either as part of the paper or as linked, computer-interpretable files so that readers can perform or confirm statistical analyses themselves.

Professor Vaux goes on to say

When William Strunk Jr, a professor of English, was faced with a flood of errors in spelling, grammar and English usage, he wrote a short, practical guide that became The Elements of Style(also known as Strunk and White). Perhaps experimental biologists need a similar booklet on statistics.

And here I have to quibble. Experimental biologists already have too many guides like Strunk & White, full of outdated prejudices and policies that the authors themselves would not follow.  What we need is a guide that lays out how good scientists and statisticians actually do handle common types of experiment (ie, evidence-based standard recipes), together with some education on the basic principles: contrasts, blocking, randomization, sources of variation, descriptions of uncertainty. And perhaps a few entertaining horror stories of Doing It Rong and the consequences.


January 22, 2013

The house always wins

The Herald has a good story about gambling: the total expenditure net of winnings is $2 billion/year, [update or $16billion gross] about $3600 per capita.  That’s quite a lot. For example, looking at the Retail Trade Survey, it’s about twice what we spend on alcohol, and about the same as expenditures on all recreational goods.

What’s harder to tell is how the expenditures break down across

It’s quite possible that the last category is a large fraction of total expenditure, while being a small fraction of total people.


[update: the $3600 figure includes winnings. Losses are a more plausible $450/capita]

January 21, 2013

Seasonal units of measurements

Stuff says (complete with cute photo)

The birth of a rare Nepalese red panda baby, weighing not much more than a tomato, has thrilled Auckland Zoo keepers.

Hmm.

pandasize

Especially given all the fuss last year about New Zealanders’ ignorance of vegetables, perhaps “weighing a bit less than an iPhone” would be more informative.


Minus several million for good thinking

A monstrosity from The Globe & Mail (Canada)

Globe & Mail (via Dennis Cotes & Andrew Gelman)


Andrew Gelman demolishes it and suggests better ways to display the data.  His conclusion is interesting

But that’s part of the problem—the clearer graph would also be easier to make! To get a distinctive graph, there needs to be some degree of difficulty.

In other words, ten out of ten for style.

For the record

This weekend, Christchurch had its biggest aftershock for six months.  The moon was substantially further from the earth than average.