May 16, 2013
Explore the budget
Keith Ng’s budget visualisation now has today’s newly-released Government budget.
(update) There’s also one at Stuff, by Harkanwal Singh (note that it uses nominal, not inflation-adjusted amounts)
Keith Ng’s budget visualisation now has today’s newly-released Government budget.
(update) There’s also one at Stuff, by Harkanwal Singh (note that it uses nominal, not inflation-adjusted amounts)
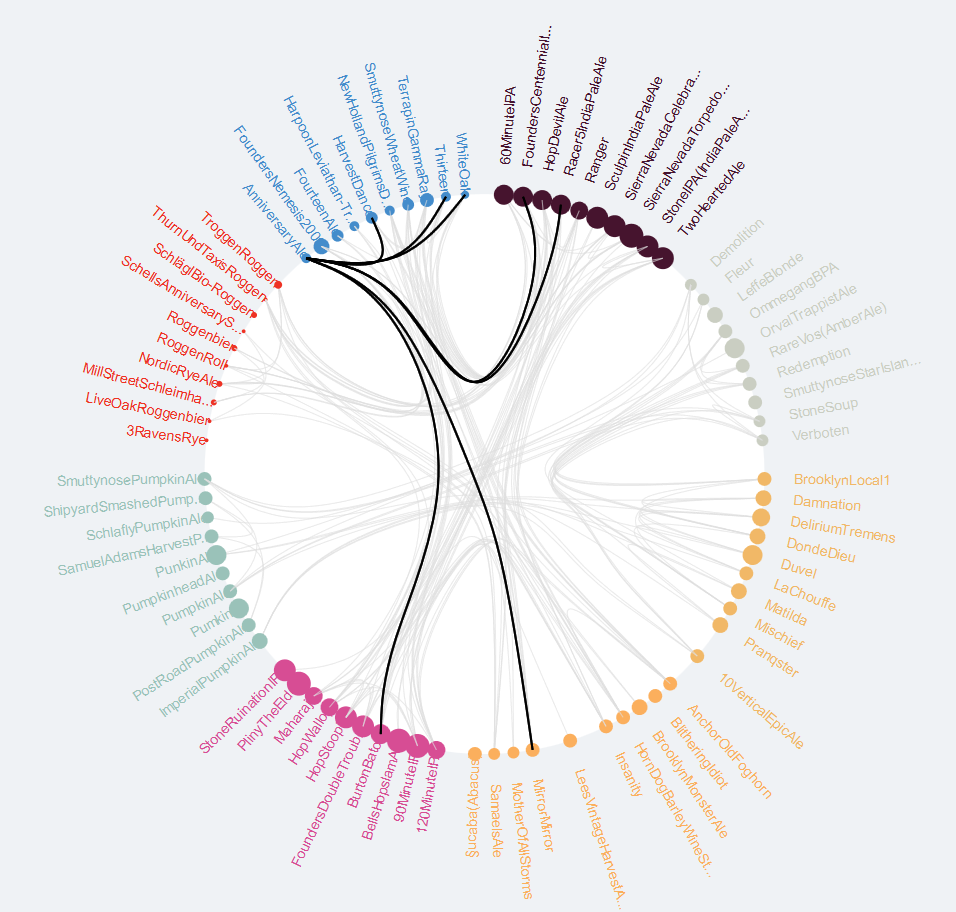
Here is a site to show with a flourish when your friends tell you at the pub that studying Statistics is no use. LifeHacker reports that BeerViz attempts to use historical data collected by BeerAdvocate, and presumably a statistical model, to suggest new beers to you based on what you already like. If they’re not using a statistical model then there is a great challenge for you loyal readers!
A report by research firm Strategy Analytics has estimated that Korean electronics giant Samsung took a whopping 94.7% share of the $US5.3 billion first quarter operating profits for Android handset sales. Whichever way you look at it, currently Samsung is the Android platform of choice.
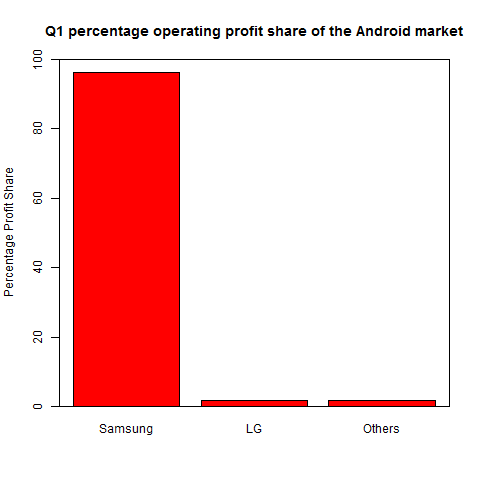
The Register notes that the same report notes that Android has 43% of the smartphone market share.

Rafa Irizarry at Simply Statistics has a longish piece on the future of applied statistics:
Despite having expertise only in music, and a thesis that required a CD player to hear the data, fitted models and residuals , I was hired by the Department of Biostatistics at Johns Hopkins School of Public Health. Later I realized what was probably obvious to the School’s leadership: that regardless of the subject matter of my thesis, my time series expertise could be applied to several public health applications. The public health and biomedical challenges surrounding me were simply too hard to resist and my new department knew this. It was inevitable that I would quickly turn into an applied Biostatistician.
It makes a nice change from the people worrying that computer science will beat us up and steal our lunch.