Posts from June 2013 (39)

June 11, 2013

CensusAtSchool on Nine to Noon this morning

This morning sometime after 11am, I’ll be talking on Radio New Zealand’s Nine to Noon programme about one of the Department’s projects, CensusAtSchool. I’ll post a link to the interview recording once it’s online.

CensusAtSchool runs biennial surveys online to get data of interest to Year 5-13 students by asking them questions about themselves. This data then feeds into the teaching and learning about statistics. The surveys produce data about kids, from kids, for kids – to enrich their learning about how to collect, explore and analyse data.

The project also goes much further and provides support to teachers across all dimensions of teaching statistics in schools in New Zealand.

For more, see the CensusAtSchool website.

Update:

June 10, 2013

Stat of the Week Competition: June 8 – 14 2013

Each week, we would like to invite readers of Stats Chat to submit nominations for our Stat of the Week competition and be in with the chance to win an iTunes voucher.

Here’s how it works:

  • Anyone may add a comment on this post to nominate their Stat of the Week candidate before midday Friday June 14 2013.
  • Statistics can be bad, exemplary or fascinating.
  • The statistic must be in the NZ media during the period of June 8 – 14 2013 inclusive.
  • Quote the statistic, when and where it was published and tell us why it should be our Stat of the Week.

Next Monday at midday we’ll announce the winner of this week’s Stat of the Week competition, and start a new one.

(more…)

Stat of the Week Competition Discussion: June 8 – 14 2013

If you’d like to comment on or debate any of this week’s Stat of the Week nominations, please do so below!

June 9, 2013

What the NSA can’t do by data mining

In the Herald, in late May, there was a commentary on the importance of freeing-up the GCSB to do more surveillance. Aaron Lim wrote

The recent bombings at the Boston Marathon are a vivid example of the fragmented nature of modern warfare, and changes to the GCSB legislation are a necessary safeguard against a similar incident in New Zealand.

 …

Ceding a measure of privacy to our intelligence agencies is a small price to pay for safe-guarding the country against a low-probability but high-impact domestic incident.

Unfortunately for him, it took only a couple of weeks for this to be proved wrong: in the US, vastly more information was being routinely collected, and it did nothing to prevent the Boston bombing.  Why not?  The NSA and FBI have huge resources and talented and dedicated staff, and have managed to hook into a vast array of internet sites. Why couldn’t they stop the Tsarnaevs, or the Undabomber, or other threats?

The statistical problem is that terrorism is very rare.  The IRD can catch tax evaders, because their accounts look like the accounts of many known tax evaders, and because even a moderate rate of detection will help deter evasion.  The banks can catch credit-card fraud, because the patterns of card use look like the patterns of card use in many known fraud cases, and because even a moderate rate of detection will help deter fraud.  Doctors can predict heart disease, because the patterns of risk factors and biochemical meausurements match those of many known heart attacks, and because even a moderate level of accuracy allows for useful gains in public health.

The NSA just doesn’t have that large a sample of terrorists to work with.  As the FBI pointed out after the Boston bombing, lots of people don’t like the United States, and there’s nothing illegal about that.  Very few of them end up attempting to kill lots of people, and it is so rare that there aren’t good patterns to match against.   It’s quite likely that the NSA can do some useful things with the information, but it clearly can’t stop `low-probability, high-impact domestic incidents’, because it doesn’t.  The GCSB is even more limited, because it’s unlikely to be able to convince major US internet firms to hand over data or the private keys needed to break https security.

Aaron Lim’s piece ended with the typical surveillance cliche

And if you have nothing to hide from the GCSB, then you have nothing to fear

Computer security expert Bruce Schneier has written about this one extensively, so I’ll just add that if you believe that, you can easily deduce Kristofferson’s Corollary

Freedom’s just another word for nothing left to lose.
June 7, 2013

Proper use of denominators

Mathew Dearnaley, in the Herald, has a story today about dangerous roads where he observes that the largest number of deaths is in the Auckland region, but immediately points out that what matters is the individual risk, estimated by fatalities per million km travelled.  We’ve been over this point quite a lot on StatsChat, so it’s great to see proper use of denominators in public.

When you divide by total distance travelled, to get a fair comparison, it  turns out that Gisborne has the most dangerous roads, followed by Taranaki, and that Auckland, like Wellington, is relatively safe.

Although Waikato roads claimed 66 lives – more than a fifth of a national toll of 308 deaths – the odds of being among the 10 people who died in crashes between the Wharerata Hills south of Gisborne and East Cape were almost twice as high as in the busier northern region.

One problem with the story is the issue of random variation.  According to NZTA, Hawkes Bay and Gisborne together had a total of 16 deaths last year, up from 8 the previous year.  There’s a lot of noise in these numbers, and even though the story sensibly looked at serious injuries as well, it’s hard to tell how much of the difference between regions is real and how much is chance.

It would be helpful to add up data over multiple years, though even then there is a problem, since we know that road deaths decreased noticeably in mid-2010, and this decrease may not have been uniform across regions.

You don’t sound like you’re from round here

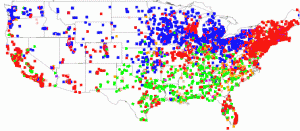
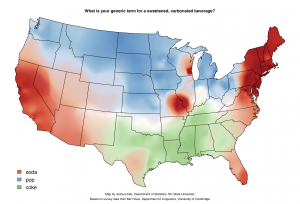
Joshua Katz, a statistics PhD student at North Carolina State University, has produced a beautiful set of maps of US dialect.  He used data from the Dialect Survey conducted by Bruce Vaux, of Harvard University.

As an example, people in various parts of the US were asked about their generic name for sweetened carbonated soft drinks: soda, pop, or coke.

spcMap


The original maps by Prof Vaux were closer to the data, since they showed dots for individual respondents, but they have visual artifacts due to population density — the clear vertical edge running north from Texas is a rainfall threshold, not a dialect boundary.

sodamap

Don’t worry, we don’t mean it

While looking into mobile internet options for a trip to Europe, I saw an ad for one of those products that’s supposed to stop dangerous mobile-phone radiation — as usual, it probably wouldn’t work even if dangerous mobile-phone radiation existed.

The company (which is in NZ), says

Cellguard® uses Frequency Infused Technology (FIT) which works to enhance the Bio energy function of the body.

With enhanced Bio energy function your body is better able to maintain an optimum state of wellbeing and significantly reduce the impact of the considered effects of mobile phone use.

which I think qualifies as “not even false”.  They also sell a product that is supposed to improve the acid/alkaline balance in your body — if you drink it, or rub on your skin or sprayed it up your  nose.

a modified liquid silica that is high in oxygen and is highly alkaline to help offset our acidic lifestyles. Alka Vita has a high pH of around 14.3 and is non corrosive ..

The ‘high in oxygen’ doesn’t sound plausible, but who knows? On the other hand, if it has a pH of 14.3 and is non-corrosive, they clearly don’t mean what chemists mean by ‘pH’.  14.3 is more alkaline than drain cleaner, and 60 times more alkaline than the NZ legal limit for dishwasher detergent.

Fortunately, the legal disclaimer page says

The information provided on this website is not intended as professional advice, but as guidelines for convenience only, upon the condition that you, by receiving or reading the material contained on this website, agree not to act in reliance upon it without first satisfying yourself by independent inquiry or advice as to the suitability, appropriateness, relevance, nature, fitness or purpose, likely side effects or long term effects, accuracy, reliability or otherwise of that material, having regard (without limitation) to your physical state, and your general fitness or medical condition.

June 5, 2013

NRL Predictions, Round 13

Team Ratings for Round 13

Here are the team ratings prior to Round 13, along with the ratings at the start of the season. I have created a brief description of the method I use for predicting rugby games. Go to my Department home page to see this.

Current Rating Rating at Season Start Difference
Rabbitohs 9.55 5.23 4.30
Storm 7.39 9.73 -2.30
Roosters 6.08 -5.68 11.80
Sea Eagles 5.55 4.78 0.80
Panthers 2.25 -6.58 8.80
Knights 1.78 0.44 1.30
Sharks 1.05 -1.78 2.80
Raiders 0.43 2.03 -1.60
Titans 0.21 -1.85 2.10
Bulldogs 0.15 7.33 -7.20
Cowboys -0.71 7.05 -7.80
Dragons -3.15 -0.33 -2.80
Broncos -3.96 -1.55 -2.40
Warriors -4.71 -10.01 5.30
Wests Tigers -11.21 -3.71 -7.50
Eels -14.44 -8.82 -5.60


Performance So Far

So far there have been 92 matches played, 57 of which were correctly predicted, a success rate of 61.96%.

Here are the predictions for last week’s games.

Game Date Score Prediction Correct
1 Bulldogs vs. Dragons May 31 16 – 14 9.24 TRUE
2 Rabbitohs vs. Knights Jun 01 25 – 18 13.58 TRUE
3 Titans vs. Cowboys Jun 02 31 – 12 2.02 TRUE
4 Broncos vs. Warriors Jun 03 18 – 56 16.07 FALSE


Predictions for Round 13

Here are the predictions for Round 13. The prediction is my estimated expected points difference with a positive margin being a win to the home team, and a negative margin a win to the away team.

Game Date Winner Prediction
1 Eels vs. Roosters Jun 07 Roosters -16.00
2 Knights vs. Dragons Jun 08 Knights 9.40
3 Cowboys vs. Bulldogs Jun 08 Cowboys 3.60
4 Warriors vs. Sea Eagles Jun 09 Sea Eagles -5.80
5 Panthers vs. Wests Tigers Jun 09 Panthers 18.00
6 Storm vs. Sharks Jun 09 Storm 10.80
7 Raiders vs. Broncos Jun 10 Raiders 8.90


Super 15 Predictions, Round 17

Team Ratings for Round 17

This year the predictions have been slightly changed with the help of a student, Joshua Dale. The home ground advantage now is different when both teams are from the same country to when the teams are from different countries. The basic method is described on my Department home page.

Here are the team ratings prior to Round 17, along with the ratings at the start of the season.

Current Rating Rating at Season Start Difference
Crusaders 6.03 9.03 -3.00
Bulls 5.96 2.55 3.40
Chiefs 4.64 6.98 -2.30
Brumbies 3.54 -1.06 4.60
Sharks 2.26 4.57 -2.30
Stormers 1.11 3.34 -2.20
Waratahs 0.97 -4.10 5.10
Reds 0.17 0.46 -0.30
Hurricanes -1.55 4.40 -5.90
Blues -1.62 -3.02 1.40
Cheetahs -1.63 -4.16 2.50
Highlanders -5.35 -3.41 -1.90
Rebels -8.01 -10.64 2.60
Force -8.38 -9.73 1.40
Kings -12.93 -10.00 -2.90


Performance So Far

So far there have been 101 matches played, 68 of which were correctly predicted, a success rate of 67.3%.

Here are the predictions for last week’s games.

Game Date Score Prediction Correct
1 Crusaders vs. Waratahs May 31 23 – 22 10.60 TRUE
2 Brumbies vs. Hurricanes May 31 30 – 23 9.50 TRUE
3 Highlanders vs. Blues Jun 01 38 – 28 -3.40 FALSE
4 Reds vs. Rebels Jun 01 33 – 20 10.20 TRUE
5 Stormers vs. Kings Jun 01 19 – 11 18.20 TRUE
6 Cheetahs vs. Bulls Jun 01 25 – 30 -5.10 TRUE


Predictions for Round 17

Here are the predictions for Round 17. The prediction is my estimated expected points difference with a positive margin being a win to the home team, and a negative margin a win to the away team.

Game Date Winner Prediction
1 Brumbies vs. Rebels Jun 07 Brumbies 14.00
2 Force vs. Waratahs Jun 09 Waratahs -6.90


June 4, 2013

Survey respondents are lying, not ignorant

At least, that’s the conclusion of a new paper from the National Bureau of Economic Research.

It’s a common observation that some survey responses, if taken seriously, imply many partisans are dumber than a sack of hammers.  My favorite example is the 32% of respondents who said the Gulf of Mexico oil well explosion made them more likely to support off-shore oil drilling.

As Dylan Matthews writes in the Washington Post, though, the research suggests people do know better. Ordinarily they give the approved politically-correct answer for their party

In the control group, the authors find what Bartels, Nyhan and Reifler found: There are big partisan gaps in the accuracy of responses. …. For example, Republicans were likelier than Democrats to correctly state that U.S. casualties in Iraq fell from 2007 to 2008, and Democrats were likelier than Republicans to correctly state that unemployment and inflation rose under Bush’s presidency.

But in an experimental group where correct answers increased your chance of winning a prize, the accuracy improved markedly:

Take unemployment: Without any money involved, Democrats’ estimates of the change in unemployment under Bush were about 0.9 points higher than Republicans’ estimates. But when correct answers were rewarded, that gap shrank to 0.4 points. When correct answers and “don’t knows” were rewarded, it shrank to 0.2 points.

This is probably good news for journalism and for democracy.  It’s not such good news for statisticians.