November 10, 2013
Data visulisation (with cartoons and video)
From Fresh Spectrum,
The natural constraints of a paper journal didn’t give me an opportunity to dive into the practical side of the subject, but that’s why it’s nice to have a blog. This post is the first in a series I have planned on data visualization. Call it an introduction to interactivity, hope you like it.
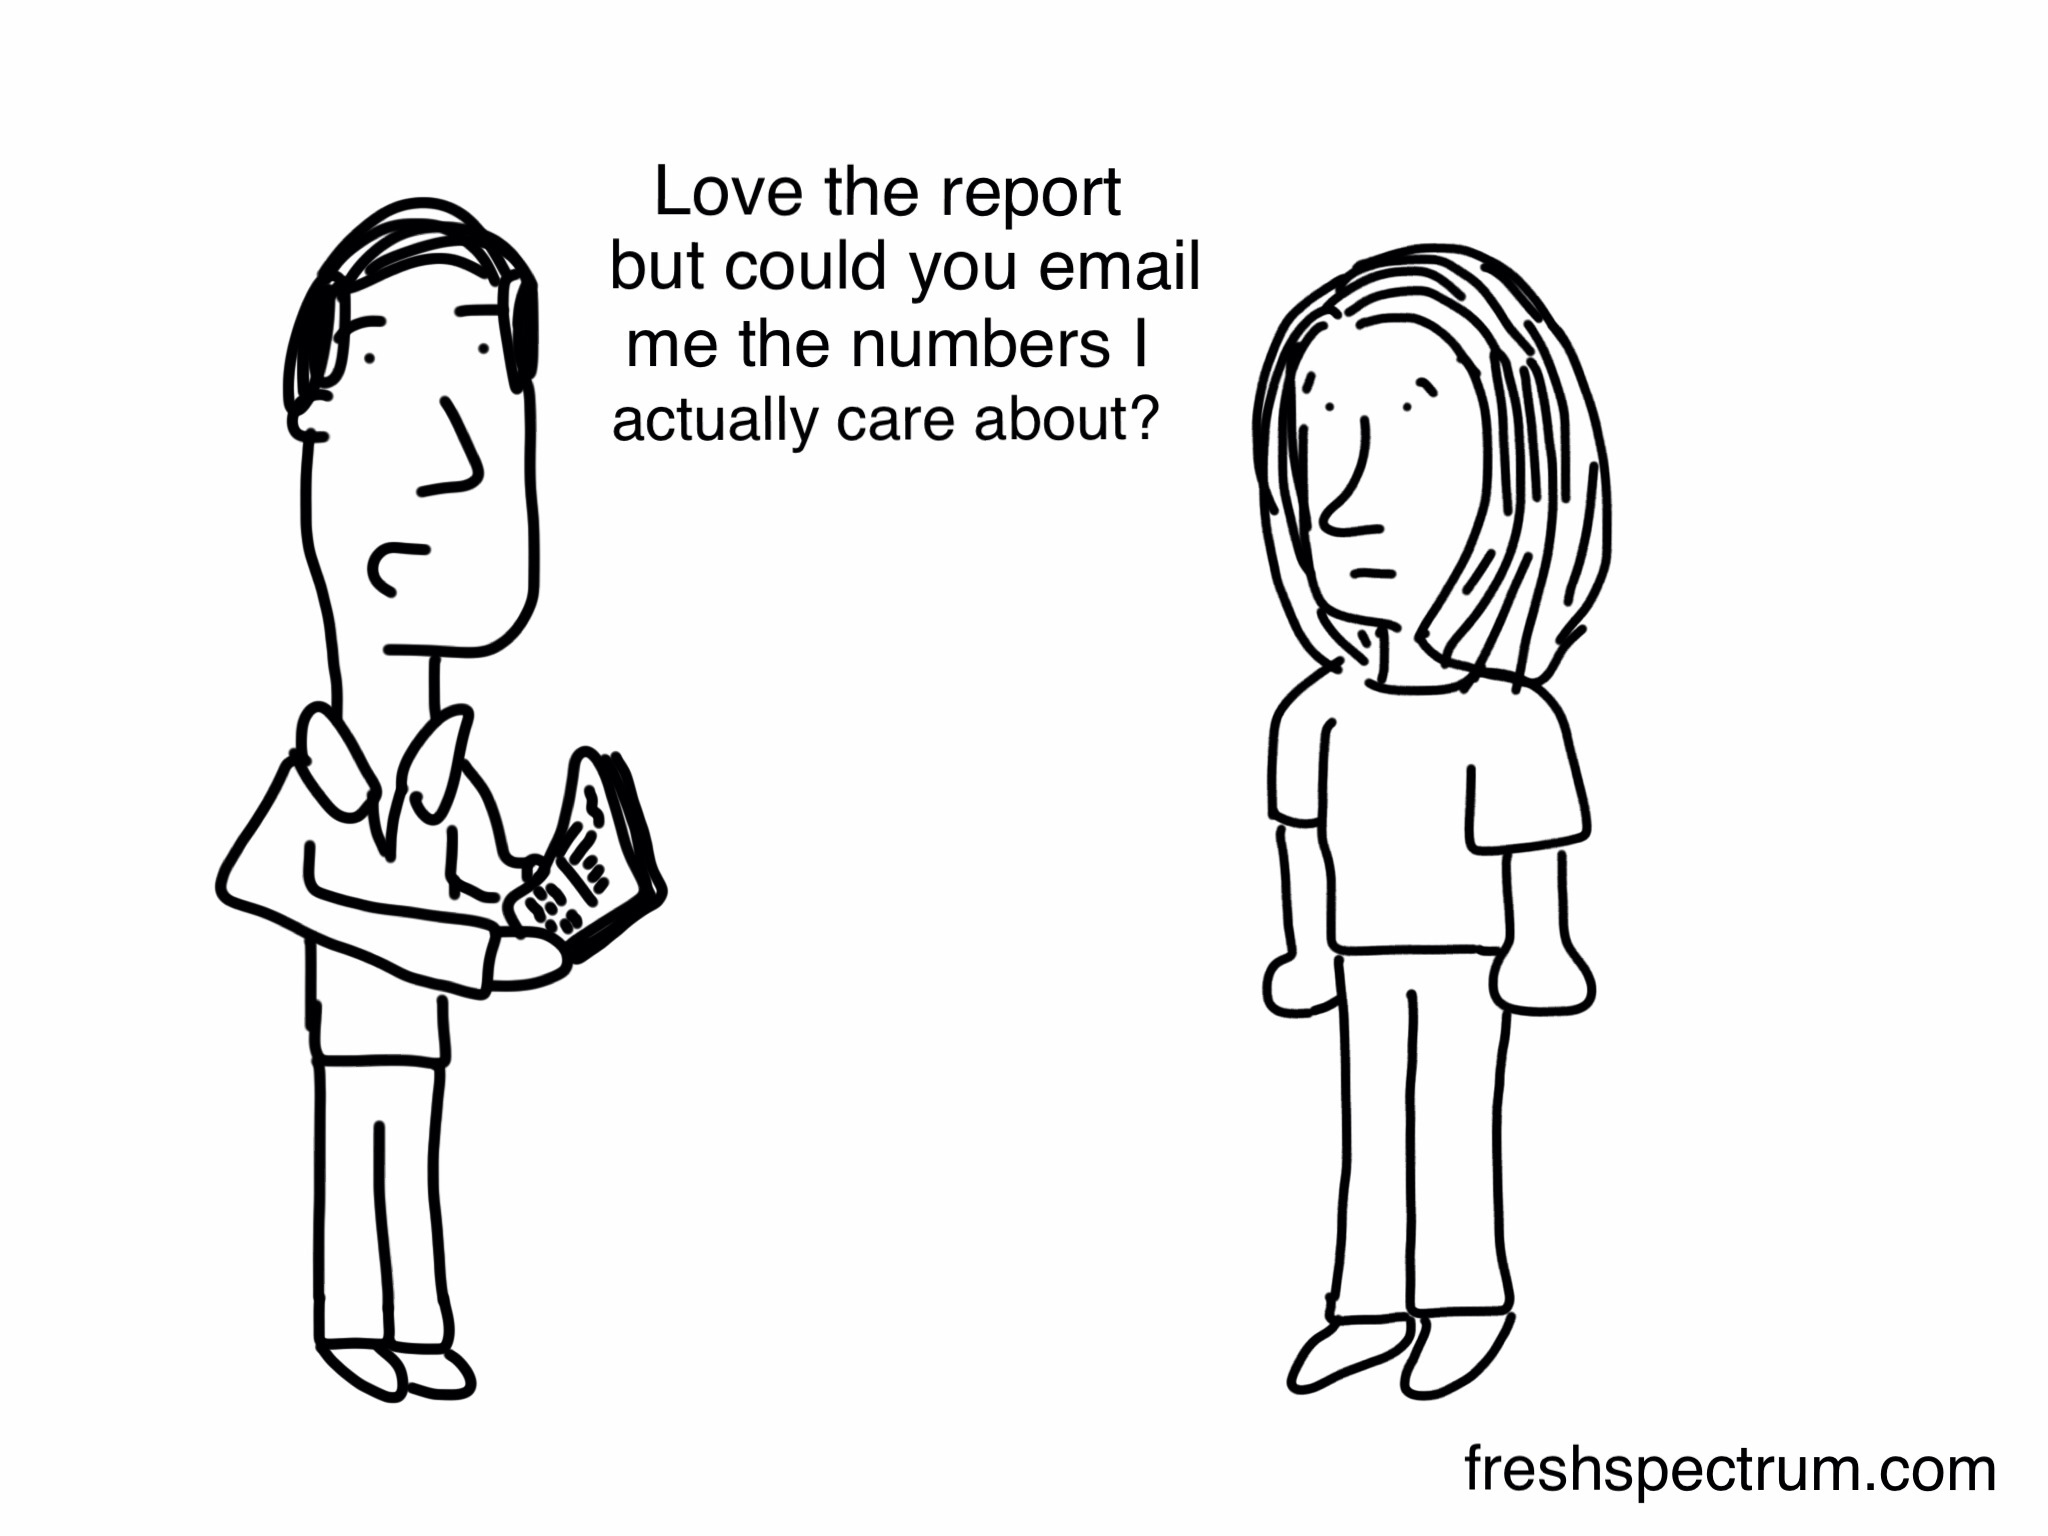
The basic reason for interactivity: not everyone wants the same numbers
Thomas Lumley (@tslumley) is Professor of Biostatistics at the University of Auckland. His research interests include semiparametric models, survey sampling, statistical computing, foundations of statistics, and whatever methodological problems his medical collaborators come up with. He also blogs at Biased and Inefficient See all posts by Thomas Lumley »