Posts from December 2013 (51)

December 31, 2013

Problems with genetic testing

Genetic testing has had a lot of overmarketing — even the most obvious poster-child application in clinical medicine, setting doses of warfarin, has been disappointing in clinical trials. Here are two recent pieces you might want to read

In a New York Times story, a journalist had her DNA tested by three companies.  The level of agreement was not, shall we say, ideal

After my tests had been sent, I braced myself for the revelations about my DNA. It took about two months to receive all the results, and when I did, the discrepancies were striking.

23andMe said my most elevated risks — about double the average for women of European ethnicity — were for psoriasis and rheumatoid arthritis, with my lifetime odds of getting the diseases at 20.2 percent and 8.2 percent. But according to Genetic Testing Laboratories, my lowest risks were for — you guessed it — psoriasis (2 percent) and rheumatoid arthritis (2.6 percent).

If you actually work with genome-wide disease data it’s not surprising that the predictions are neither accurate nor consistent, but that isn’t the impression the industry is promoting.

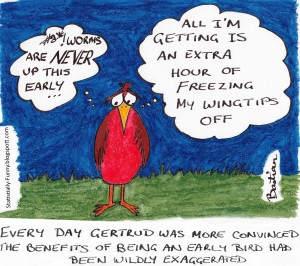
Hilda Bastian drew this cartoon at Statistically Funny

Early-bird

heading a general post about the problems with early-detection programs.

There’s a general bias in favour of screening and early detection, because it seems obviously good. And, in fact, there’s a standard mathematical result that the value of information can’t be negative. But the key assumptions in this result are that you know what information you’ve got and that you can just ignore the result if you want to. It doesn’t apply to real-life medical testing.

Meet Manasi Parulekar, Statistics Summer Scholar

Every year, the Department of Statistics offers summer scholarships to a number of students so they can work with our staff on real-world projects. We’ll be profiling them on Stats Chat. 

Manasi is working with Dr Yannan Jiang on a project titled Bariatric surgery and diabetic retinopathy progression. She explains:

“Bariatric surgery is an effective method to achieve rapid weight reduction along with a sustained remission of type 2 diabetesManasi (T2D). However, the effect of the surgery on the progression of diabetes retinopathy (DR) – retinal damage that can lead to loss of vision in both the short and long term – is not documented.

“It is hypothesised that bariatric surgery could be associated with a worsening of DR. In this project, I will be working together with Debbie Chen, a medical student from the Faculty of Medical and Health Sciences, under the joint supervision of Dr Rinki Murphy and Dr Yannan Jiang, to assess the impact of bariatric surgery on DR among patients with T2D.

“This research is very useful, as the results will be used to create the first retinal screening protocols for those having undergone bariatric surgery. So we’ll be creating guidelines to channel limited resources and identify those most at risk.

“I have completed a Bachelor of Science majoring in Psychology and Pharmacology and a Graduate Diploma in Statistics. In 2014 I will be doing my Honours in Statistics.

“Statistics excites me as it is an incredibly diverse field that is applicable to almost everything we do. It is fun to be able to break down large datasets to find patterns and solve problems to get a better understanding of the world around us. The Department of Statistics at the University of Auckland has made the experience especially enjoyable as the lecturers are friendly and approachable and the administration staff are very helpful, creating a great environment in which to learn.

“Over the summer, I will be relaxing by drawing, catching up with family and friends – and I am spending two weeks in India around New Year.”


December 30, 2013

Diversification

There’s a story on NPR news about college advertising brochures.

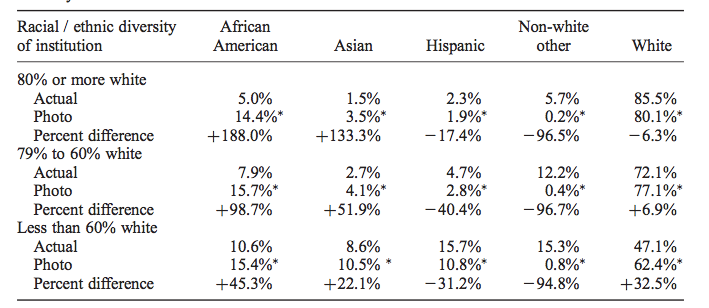
Pippert and his researchers looked at more than 10,000 images from college brochures, comparing the racial breakdown of students in the pictures to the colleges’ actual demographics. They found that, overall, the whiter the school, the more diversity depicted in the brochures, especially for certain groups.

When you look at the research paper it turns out that’s not quite right. The main data table (Table 3) is

diversity

What it shows is that the proportion of African-American students in photos in the brochure is actually pretty much constant, regardless of the proportion at the university. It’s the exaggeration that increases for whiter campuses.  It would have been nice to see this in a graph (and also perhaps see White+Asian pooled), but sociology doesn’t routinely do graphs (Kieran Healy has a paper trying to get them to)

Interestingly, the 15% or so proportion of African-American students in photos is above the proportion in the population as a whole (12.4%), but is very close to the proportion in the 16-19 age band, which includes the target audience for these brochures. That may well be just a coincidence, since there’s enough geographical variation that basically no-one is exposed to what the US population proportion looks like.

Meet Cennaning Li, Statistics Summer Scholar 2013-2014

Every year, the Department of Statistics at the University of Auckland offers summer scholarships to a number of students so they can work with our staff on real-world projects. We’ll be profiling the 2013-2014 summer scholars on Stats Chat. Cennaning is working with Associate Professor  David Scott on a project titled Enhancement of the metaplot package.

Cennaning (right) explains:Cenanning Li

“In R, there are three major meta-analysis packages (meta, rmeta and metafor) for producing forest plots. However, the generated plots are quite complicated, and it’s not easy to customise the plots if users lack good R knowledge and experience. The metaPlot package created by former University of Auckland student Edna Lu is used to create flexible forest plots and implements the grid-naming scheme to allow for specific customisations. Basically, it extracts the output generated by these three packages and recreates more flexible plots. This is convenient for users customising complicated plots generated by meta, rmeta and metaphor.

“Currently, only some of the possible outputs from meta can be used by metaPlot to produce forest plots; therefore, in this project, I will try to finish the original aim of the package to enable metaPlot to produce all possible outputs from meta, and then extend this functionality to the other two packages.

“The various features of a standard forest plot will lead to many complications in customising such a plot. If we check out the three major meta-analysis packages, we often find there is often more flexibility needed in the plots than a single function can accommodate. In order to customise the forest plots, users have to scan through all the arguments to make any modifications. If they have a preferred set of formats, they have to specify these arguments every time a similar forest plot is drawn. Therefore, by pursuing this research, we can complete the package that provides these customisations but add further flexibility with a different approach to the function design.

“I have a conjoint Bachelor of Commerce/Bachelor of Science degree, and I am doing a Bachelor of Science (Honours) in Statistics. Studying statistics has greatly improved my problem-solving abilities.

“Statistics is a very useful tool; it’s useful in almost any industry, especially in this age where almost everything we do produces data. Did you know that Netflix’s decision to make the political drama House of Cards, starring Kevin Spacey, was based on mining billions of bits of information collected from its millions of consumers? You can find out more in this article. This is why statistics appeals to me.

Cenanning Li“Outside university, I like playing music – I enjoy jamming with different musicians, and I am vice-president of the Guitar Union. Over the summer, I’ll probably be spending some time seeing friends, watching movies and playing computer games.”

December 29, 2013

Auckland population density

This is a satellite photo of the 5th most densely populated census area unit (out of 411) in the Auckland supercity, based on 2013 census data.

burbank
(more…)

Brute force and ignorance

My grandfather, a high school maths teacher, characterised a mathematician as someone who would rather spend an hour working out the quick way to solve a problem than fifteen minutes doing it the slow way.

Computers are so fast nowadays that many traditional ‘recreational maths’ problems can be solved by some brute-force approach. Christian Robert translates an example from Le Monde,

A regular die takes the values 4, 8 and 2 on three adjacent faces. Summit values are defined by the product of the three connected faces, e.g., 64 for the above. What values do the three other faces take if the sum of the eight summit values is 1768? 

and provides R code that just tries lots of possibilities. On my laptop, the code runs in about a quarter of a second.

More practically, the same applies to a lot of calculations in statistics –for example, if you need to work out what sample size is needed for an experiment, it’s often easier to simulate the experiment at different sizes and see what happens than to work out the solution mathematically.

There’s a similar problem for quizzes that are often made trivial by Google. Often, but not always. The famous Christmas quiz from King William’s College, on the Isle of Man is made easier by search engines, but still takes effort. For example, the first question:

In the year 1913: what famous club was founded at Vrijstraat 20?

You won’t get the answer just by Googling “Vrijstaat 20”, at least not yet (eventually Google will pick up on it), but with a bit of extra effort you can determine it must be PSV Eindhoven (select the white text, if you want the answer).

Some graph links


December 28, 2013

Other blogs you should maybe read

A non-comprehensive collection of blogs on relevant topics that I read fairly regularly and you might like. These average more technical than StatsChat.

Statistics, Graphics, and Data Science

Statistics-adjacent

Other social science

Stuff about science

Journalism

Other recommendations welcome in the comments: in particular, I’m well aware that my regular technical blog reading seems to be dominated by white men.

December 27, 2013

Briefly

  • When petrol companies raise prices, they always claim it’s due to increased costs. Wouldn’t it be nice if you could tell whether they were lying liars who lie or impotent cogs in the uncaring machine of international trade? Well, as we regularly point out, the NZ Government tracks the difference between import costs and retail costs for petrol, precisely so you can tell.  They aren’t up to their usual standard right now, because of the holidays, but they start surveying again on Jan 7.
  • UK charity Sense about Science has decided not to put out its annual summary of misleading science claims by celebrities, because it hasn’t been as bad as usual this year. They made a ‘greatest hits’ summary instead.
  • Google Ads, for some reason, thinks I would be interested in a rubber wristband that purports to generate anions to improve health.  There are physics problems (it probably doesn’t generate anions), medical problems (if it did, they wouldn’t help), general cluelessness (a mylar hologram is described as not containing technology), but there’s also a statistical problem. They say “Most Endevr™ users report positive benefits with our products” but unless they are in league with the NSA (or Santa) they couldn’t possible know this — a national survey would have to sample huge numbers to collect a reasonable group of users, and since the bracelet is sold over the counter at Target and some pharmacy chains, they can’t sample users directly.

Meet Tania Tian, Statistics Summer Scholar 2013-2014

Every year, the Department of Statistics at the University of Auckland offers summer scholarships to a number of students so they can work with our staff on real-world projects. We’ll be profiling the 2013-2014 summer scholars on Stats Chat. Tania is working with Dr Stephanie Budgett on a project titled First-time mums: Can we make a difference?

Tania (right) explains:Tania Tian

“This project is based on the ongoing levator ani study (LA, commonly known as the pelvic floor muscles) from the Pelvic Floor Research Group at the Auckland Bioengineering Institute (ABI), which looks at how the pelvic floor muscles change after first-time mums give birth.

“The aim is to see whether age, ethnicity, delivery conditions and other related factors are associated with the tearing of the muscle. Interestingly, the stiffness of the muscle at rest has been identified as a key factor and is being measured by a specially designed device, an elastometer, that was built by engineers at the ABI.

“Pelvic-floor muscle injury following a vaginal delivery can increase the risks for prolapse where pelvic organs, such as the uterus, small bowl, bladder and rectum, descend and herniate. Furthermore, the muscle trauma may also promote or intensify urinary and/or bowel incontinence.

“Not only do these pelvic- floor disorders cause discomfort and distress, and reduce the mother’s quality of life, and, if left untreated, may lead to major health concerns later in life. Therefore, a statistical model based on key factors elucidated from the study may aid health professionals in deciding the best strategy for delivering a woman’s baby and whether certain interventions are needed.

“I have recently completed my third year of a Bachelor of Science majoring in Statistics and Pharmacology and intend to pursue postgraduate studies. I hope to integrate my knowledge of medical sciences and statistics and specialise in medical statistics.

“Statistics appeals to me because it is a useful field with direct practical applications in almost every industry. I had initially taken the stage one paper as a standalone in order to broaden my knowledge, but eventually realised that I really liked the subject and that it could complement whichever career I have. That’s when I decided to major in statistics, and I’m very glad that I did.

“Over this summer, aside from the project, I am hoping to spend more time with friends and family – especially with my new baby brother! I am also looking forward to visiting the South Island during the Christmas break.”