Posts from July 2014 (54)

July 23, 2014

Average and variation

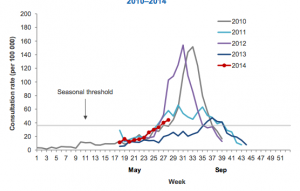
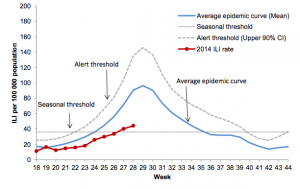
Two graphs from the NZ influenza surveillance weekly update (PDF, via Mark Hanna)

flu-averageflu-varying

Both show that the seasonal epidemic has started.  I think the second graph is more helpful in comparing this year to the past; showing the actual history for a range of years, rather than an average.  This sort of graph could handle a larger number of past years if they were all or mostly in, eg, thin grey lines, perhaps with this year, last year, and the worst recent year in colour.

The other news in the surveillance update is that the flu viruses that have been examined have overwhelming been H1N1 or H3N2, and both these groups are covered in this year’s vaccine.

The self-surveillance world

See anyone you know? (click to embiggen)

cats


This is a screenshot from I know where your cat lives, a project at Florida State University that is intended to illustrate the amount of detailed information available from location-tagged online photographs, without being too creepy — just creepy enough.

(via Robert Kosara and Keith Ng)

NRL Predictions for Round 20

Team Ratings for Round 20

The basic method is described on my Department home page. I have made some changes to the methodology this year, including shrinking the ratings between seasons.

Here are the team ratings prior to this week’s games, along with the ratings at the start of the season.

Current Rating Rating at Season Start Difference
Sea Eagles 8.06 9.10 -1.00
Roosters 8.02 12.35 -4.30
Rabbitohs 6.67 5.82 0.90
Warriors 5.50 -0.72 6.20
Cowboys 4.07 6.01 -1.90
Broncos 3.33 -4.69 8.00
Panthers 1.50 -2.48 4.00
Storm 0.42 7.64 -7.20
Bulldogs 0.06 2.46 -2.40
Knights -2.24 5.23 -7.50
Titans -3.51 1.45 -5.00
Dragons -4.19 -7.57 3.40
Wests Tigers -5.06 -11.26 6.20
Raiders -5.42 -8.99 3.60
Sharks -8.78 2.32 -11.10
Eels -10.21 -18.45 8.20


Performance So Far

So far there have been 136 matches played, 78 of which were correctly predicted, a success rate of 57.4%.

Here are the predictions for last week’s games.

Game Date Score Prediction Correct
1 Sharks vs. Cowboys Jul 18 18 – 36 -6.10 TRUE
2 Eels vs. Rabbitohs Jul 18 12 – 32 -10.60 TRUE
3 Roosters vs. Panthers Jul 19 32 – 12 8.90 TRUE
4 Storm vs. Raiders Jul 19 28 – 14 9.40 TRUE
5 Broncos vs. Warriors Jul 19 28 – 22 1.40 TRUE
6 Knights vs. Titans Jul 20 8 – 22 10.00 FALSE
7 Wests Tigers vs. Bulldogs Jul 20 46 – 18 -6.40 FALSE
8 Dragons vs. Sea Eagles Jul 21 12 – 21 -7.40 TRUE


Predictions for Round 20

Here are the predictions for Round 20. The prediction is my estimated expected points difference with a positive margin being a win to the home team, and a negative margin a win to the away team.

Game Date Winner Prediction
1 Knights vs. Roosters Jul 25 Roosters -5.80
2 Broncos vs. Storm Jul 25 Broncos 7.40
3 Panthers vs. Sharks Jul 26 Panthers 14.80
4 Titans vs. Eels Jul 26 Titans 11.20
5 Bulldogs vs. Cowboys Jul 26 Bulldogs 0.50
6 Warriors vs. Sea Eagles Jul 27 Warriors 1.90
7 Wests Tigers vs. Dragons Jul 27 Wests Tigers 3.60
8 Raiders vs. Rabbitohs Jul 28 Rabbitohs -7.60


Super 15 Predictions for the Semi-finals

Team Ratings for the Semi-finals

The basic method is described on my Department home page. I have made some changes to the methodology this year, including shrinking the ratings between seasons.

Here are the team ratings prior to this week’s games, along with the ratings at the start of the season.

Current Rating Rating at Season Start Difference
Waratahs 9.66 1.67 8.00
Crusaders 8.78 8.80 -0.00
Sharks 5.34 4.57 0.80
Hurricanes 2.89 -1.44 4.30
Bulls 2.88 4.87 -2.00
Brumbies 2.76 4.12 -1.40
Chiefs 2.23 4.38 -2.10
Stormers 1.68 4.38 -2.70
Blues 1.44 -1.92 3.40
Highlanders -2.54 -4.48 1.90
Lions -3.39 -6.93 3.50
Force -4.67 -5.37 0.70
Reds -4.98 0.58 -5.60
Cheetahs -5.55 0.12 -5.70
Rebels -9.53 -6.36 -3.20


Performance So Far

So far there have been 122 matches played, 80 of which were correctly predicted, a success rate of 65.6%.

Here are the predictions for last week’s games.

Game Date Score Prediction Correct
1 Brumbies vs. Chiefs Jul 19 32 – 30 5.00 TRUE
2 Sharks vs. Highlanders Jul 19 31 – 27 13.00 TRUE


Predictions for the Semi-finals

Here are the predictions for the Semi-finals. The prediction is my estimated expected points difference with a positive margin being a win to the home team, and a negative margin a win to the away team.

Game Date Winner Prediction
1 Crusaders vs. Sharks Jul 26 Crusaders 7.40
2 Waratahs vs. Brumbies Jul 26 Waratahs 9.40


July 22, 2014

Stat of the Week Competition Winner: July 12 – 18 2014

Thank you for your nominations in last week’s Stat of the Week competition.

We’ve chosen Nick Iversen’s nomination of the NZ Herald article about elephants facing extinction:

The article claims that 100 elephants are killed every day and that elephants will be extinct by 2025.

Over 11 years 100 per day means 400,000 elephants will be killed. I can think of many reasons why this doesn’t mean that elephants will become extinct.

1) the killing rate will drop as elephants become more scarce

2) there will always be protected populations that aren’t subject to the killing

3) elephants are giving birth to new elephants

According to the Wikipedia page on elephants an estimate is that there were 440,000 elephants in 2012. So now we know how the author of the article did the calculations – divided 400,000 by 100 elephants a day.

So let’s keep using Wikipedia numbers and see what we find. “…populations in eastern and southern Africa were increasing by an average annual rate of 4.0%.” Well there you go. Even with culls of 100 a day the population is still growing. So no extinction.

Let’s assume that the 4% is BEFORE the culling. That’s adding 17,600 animals each year and the cull is removing 100 a day so that extends the population out for 21 years. This won’t happen due to points 1 and 2 above.

Note that the 4% figure doesn’t apply to all populations. But my point is still valid. If some populations are increasing in size there will be no extinction.

Thanks Nick for the great explanation!
Lack of correlation does not imply causation

From the Herald

Labour’s support among men has fallen to just 23.9 per cent in the latest Herald-DigiPoll survey and leader David Cunliffe concedes it may have something to do with his “sorry for being a man” speech to a domestic violence symposium.

Presumably Mr Cunliffe did indeed concede it might have something to do with his statement; and there’s no way to actually rule that out as a contributing factor. However

Broken down into gender support, women’s support for Labour fell from 33.4 per cent last month to 29.1 per cent; and men’s support fell from 27.6 per cent last month to 23.9 per cent.

That is, women’s support for Labour fell by 4.2 percentage points (give or take about 4.2) and men’s by 3.7 percentage points (give or take about 4.2). This can’t really be considered evidence for a gender-specific Labour backlash. Correlations need not be causal, but here there isn’t even a correlation.

July 21, 2014

Survival of the fittest? Latest Thomas Lumley Listener column

Thomas Lumley writes in his latest Listener column: “Since 1980, your chance of surviving five years after a heart attack has increased from just over 70% to just under 80%. For breast cancer, the five-year survival rate has gone from about 60% to about 85% in the same period of time, and for melanoma it has risen from about 80% to over 90%.

“From these figures you might conclude that breast cancer treatment has improved a lot, treatment for melanoma has not improved as much and treatment for a heart attack has improved slightly less than for melanoma. It’s actually a bit more complicated than that.”

Read the rest of the column here. 

Stat of the Week Competition: July 19 – 25 2014

Each week, we would like to invite readers of Stats Chat to submit nominations for our Stat of the Week competition and be in with the chance to win an iTunes voucher.

Here’s how it works:

  • Anyone may add a comment on this post to nominate their Stat of the Week candidate before midday Friday July 25 2014.
  • Statistics can be bad, exemplary or fascinating.
  • The statistic must be in the NZ media during the period of July 19 – 25 2014 inclusive.
  • Quote the statistic, when and where it was published and tell us why it should be our Stat of the Week.

Next Monday at midday we’ll announce the winner of this week’s Stat of the Week competition, and start a new one.

(more…)

Stat of the Week Competition Discussion: July 19 – 25 2014

If you’d like to comment on or debate any of this week’s Stat of the Week nominations, please do so below!

July 17, 2014

NRL Predictions for Round 19

Team Ratings for Round 19

The basic method is described on my Department home page. I have made some changes to the methodology this year, including shrinking the ratings between seasons.

Here are the team ratings prior to this week’s games, along with the ratings at the start of the season.

Current Rating Rating at Season Start Difference
Sea Eagles 7.87 9.10 -1.20
Roosters 6.97 12.35 -5.40
Warriors 5.98 -0.72 6.70
Rabbitohs 5.76 5.82 -0.10
Cowboys 2.96 6.01 -3.10
Bulldogs 2.96 2.46 0.50
Broncos 2.85 -4.69 7.50
Panthers 2.54 -2.48 5.00
Storm -0.05 7.64 -7.70
Knights -0.14 5.23 -5.40
Dragons -4.01 -7.57 3.60
Raiders -4.94 -8.99 4.10
Titans -5.61 1.45 -7.10
Sharks -7.67 2.32 -10.00
Wests Tigers -7.96 -11.26 3.30
Eels -9.30 -18.45 9.20


Performance So Far

So far there have been 128 matches played, 72 of which were correctly predicted, a success rate of 56.2%.

Here are the predictions for last week’s games.

Game Date Score Prediction Correct
1 Sea Eagles vs. Wests Tigers Jul 11 40 – 8 17.70 TRUE
2 Warriors vs. Eels Jul 12 48 – 0 14.10 TRUE
3 Storm vs. Bulldogs Jul 12 4 – 6 2.40 FALSE
4 Titans vs. Raiders Jul 13 20 – 36 8.00 FALSE
5 Sharks vs. Knights Jul 13 18 – 31 -0.70 TRUE
6 Panthers vs. Broncos Jul 14 35 – 34 5.00 TRUE


Predictions for Round 19

Here are the predictions for Round 19. The prediction is my estimated expected points difference with a positive margin being a win to the home team, and a negative margin a win to the away team.

Game Date Winner Prediction
1 Sharks vs. Cowboys Jul 18 Cowboys -6.10
2 Eels vs. Rabbitohs Jul 18 Rabbitohs -10.60
3 Roosters vs. Panthers Jul 19 Roosters 8.90
4 Storm vs. Raiders Jul 19 Storm 9.40
5 Broncos vs. Warriors Jul 19 Broncos 1.40
6 Knights vs. Titans Jul 20 Knights 10.00
7 Wests Tigers vs. Bulldogs Jul 20 Bulldogs -6.40
8 Dragons vs. Sea Eagles Jul 21 Sea Eagles -7.40