Posts from September 2014 (43)

September 19, 2014

Not how polling works

The Herald interactive for election results looks really impressive. The headline infographic for the latest poll, not so much. The graph is designed to display changes between two polls, for which the margin of error is 1.4 times higher than in a single poll: the margin of error for National goes beyond the edge of the graph.

election-diff


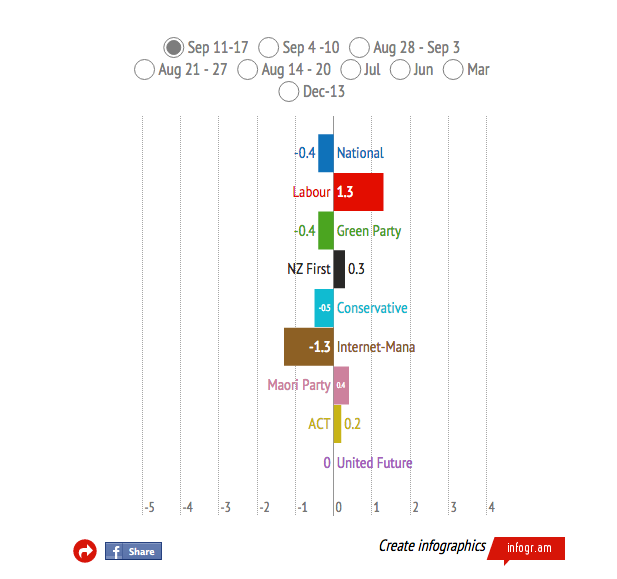
The lead for the story is worse

The Kim Dotcom-inspired event in Auckland’s Town Hall that was supposed to end John Key’s career gave the National Party an immediate bounce in support this week, according to polling for the last Herald DigiPoll survey.

Since both the Dotcom and Greenwald/Snowden Moments of Truth happened in the middle of polling, they’ve split the results into before/after Tuesday.  That is, rather than showing an average of polls, or even a single poll, or even a change from a single poll, they are headlining the change between the first and second halves of a single poll!

The observed “bounce” was 1.3%. The quoted margin of error at the bottom of the story is 3.5%, from a poll of 775 people. The actual margin of error for a change between the first and second halves of the poll is about 7%.

Only in the Internet Party’s wildest dreams could this split-half comparison have told us anything reliable. It would need the statistical equivalent of the CSI magic video-zoom enhance button to work.


September 18, 2014

Bald truth

From the Herald

Men who are bald at age 45 are more likely to develop aggressive prostate cancer compared with those who keep their hair.

US researchers found those who lose hair at the front of their heads and have moderate hair-thinning on the crown were 40 per cent more likely to develop a fast-growing tumour in their prostate.

This was compared with men with no baldness.

That’s all true, but what casts doubt on this finding is that you get the same results if you compare to men with severe baldness. That is, the research found a higher rate of aggressive prostate cancer in men who had ‘moderate’ baldness on the top of head, but not in those who had milder or more severe forms, and no increase in non-aggressive prostate cancer. Here are the estimated relative increases in risk, with confidence intervals

bald

When you consider the lack of a consistent trend, and the fact that the evidence isn’t all that strong for the moderate-baldness/aggressive-cancer combination, I don’t think this is worth getting all that excited about.

This one can mostly be blamed on the journal: the American Society of Clinical Oncology press release isn’t too bad in itself, but if you compare it to the other recent occasions when ASCO have issued a press release, it doesn’t really measure up.

Interactive election results map

The Herald has an interactive election-results map, which will show results for each polling place as they come in, together with demographic information about each electorate.  At the moment it’s showing the 2011 election data, and the displays are still being refined — but the Herald has started promoting it, so I figure it’s safe for me to link as well.

Mashblock is also developing an election site. At the moment they have enrolment data by age. Half the people under 35 in Auckland Central seem to be unenrolled,which is a bit scary. Presumably some of them are students enrolled at home, and some haven’t been in NZ long enough to enrol, but still.

Some non-citizens probably don’t know that they are eligible — I almost missed out last time. So, if you know someone who is a permanent resident and has lived in New Zealand for a year, you might just ask if they know about the eligibility rules. Tomorrow is the last day.

September 16, 2014

Revised Revised NRL Predictions for Finals Week 2

Update

Updated now to give correct teams for the game on Saturday. Thanks to ian.tinkler@xtra.co.nz for pointing out my mistake.

Team Ratings for Finals Week 2

The basic method is described on my Department home page. I have made some changes to the methodology this year, including shrinking the ratings between seasons.

Here are the team ratings prior to this week’s games, along with the ratings at the start of the season.

Current Rating Rating at Season Start Difference
Rabbitohs 11.42 5.82 5.60
Roosters 10.14 12.35 -2.20
Cowboys 8.98 6.01 3.00
Storm 4.47 7.64 -3.20
Panthers 4.45 -2.48 6.90
Broncos 3.86 -4.69 8.50
Sea Eagles 3.23 9.10 -5.90
Warriors 2.82 -0.72 3.50
Bulldogs -0.02 2.46 -2.50
Knights -0.28 5.23 -5.50
Dragons -2.10 -7.57 5.50
Raiders -7.64 -8.99 1.40
Eels -8.12 -18.45 10.30
Titans -8.40 1.45 -9.90
Sharks -10.92 2.32 -13.20
Wests Tigers -13.68 -11.26 -2.40


Performance So Far

So far there have been 196 matches played, 115 of which were correctly predicted, a success rate of 58.7%.

Here are the predictions for last week’s games.

Game Date Score Prediction Correct
1 Sea Eagles vs. Rabbitohs Sep 12 24 – 40 -6.30 TRUE
2 Roosters vs. Panthers Sep 13 18 – 19 12.70 FALSE
3 Cowboys vs. Broncos Sep 13 32 – 20 9.00 TRUE
4 Storm vs. Bulldogs Sep 14 4 – 24 14.90 FALSE


Predictions for Finals Week 2

Here are the predictions for Finals Week 2. The prediction is my estimated expected points difference with a positive margin being a win to the home team, and a negative margin a win to the away team.

Game Date Winner Prediction
1 Roosters vs. Cowboys Sep 19 Roosters 5.70
2 Sea Eagles vs. Bulldogs Sep 20 Sea Eagles 3.20


Currie Cup Predictions for Round 7

Team Ratings for Round 7

The basic method is described on my Department home page. I have made some changes to the methodology this year, including shrinking the ratings between seasons.

Here are the team ratings prior to this week’s games, along with the ratings at the start of the season.

Current Rating Rating at Season Start Difference
Western Province 6.10 3.43 2.70
Lions 2.37 0.07 2.30
Sharks 2.26 5.09 -2.80
Cheetahs -1.39 0.33 -1.70
Blue Bulls -2.18 -0.74 -1.40
Pumas -5.64 -10.00 4.40
Griquas -7.31 -7.49 0.20
Kings -13.52 -10.00 -3.50


Performance So Far

So far there have been 24 matches played, 18 of which were correctly predicted, a success rate of 75%.

Here are the predictions for last week’s games.

Game Date Score Prediction Correct
1 Kings vs. Blue Bulls Sep 12 13 – 28 -5.10 TRUE
2 Griquas vs. Pumas Sep 13 31 – 27 3.20 TRUE
3 Cheetahs vs. Sharks Sep 13 30 – 30 1.60 FALSE
4 Lions vs. Western Province Sep 13 35 – 33 1.10 TRUE


Predictions for Round 7

Here are the predictions for Round 7. The prediction is my estimated expected points difference with a positive margin being a win to the home team, and a negative margin a win to the away team.

Game Date Winner Prediction
1 Lions vs. Pumas Sep 19 Lions 13.00
2 Western Province vs. Griquas Sep 20 Western Province 18.40
3 Blue Bulls vs. Sharks Sep 20 Blue Bulls 0.60
4 Kings vs. Cheetahs Sep 20 Cheetahs -7.10


ITM Cup Predictions for Round 6

Team Ratings for Round 6

Here are the team ratings prior to Round 6, along with the ratings at the start of the season. I have created a brief description of the method I use for predicting rugby games. Go to my Department home page to see this.

Here are the team ratings prior to this week’s games, along with the ratings at the start of the season.

Current Rating Rating at Season Start Difference
Canterbury 19.69 18.09 1.60
Tasman 12.10 5.78 6.30
Wellington 8.20 10.16 -2.00
Counties Manukau 2.19 2.40 -0.20
Hawke’s Bay 2.07 2.75 -0.70
Waikato 0.77 -1.20 2.00
Auckland 0.31 4.92 -4.60
Otago -1.62 -1.45 -0.20
Taranaki -3.68 -3.89 0.20
Bay of Plenty -4.12 -5.47 1.30
Southland -5.25 -5.85 0.60
Northland -9.09 -8.22 -0.90
Manawatu -9.45 -10.32 0.90
North Harbour -14.19 -9.77 -4.40


Performance So Far

So far there have been 38 matches played, 24 of which were correctly predicted, a success rate of 63.2%.

Here are the predictions for last week’s games.

Game Date Score Prediction Correct
1 Otago vs. Northland Sep 10 23 – 40 11.80 FALSE
2 Tasman vs. Taranaki Sep 11 39 – 31 19.80 TRUE
3 North Harbour vs. Manawatu Sep 12 24 – 13 -0.70 FALSE
4 Canterbury vs. Wellington Sep 12 46 – 12 15.50 TRUE
5 Bay of Plenty vs. Auckland Sep 13 12 – 27 -0.40 TRUE
6 Southland vs. Northland Sep 13 36 – 34 7.80 TRUE
7 Waikato vs. Counties Manukau Sep 14 26 – 21 2.60 TRUE
8 Hawke’s Bay vs. Otago Sep 14 41 – 0 7.00 TRUE


Predictions for Round 6

Here are the predictions for Round 6. The prediction is my estimated expected points difference with a positive margin being a win to the home team, and a negative margin a win to the away team.

Game Date Winner Prediction
1 Southland vs. Tasman Sep 17 Tasman -13.30
2 Northland vs. Taranaki Sep 18 Taranaki -1.40
3 Counties Manukau vs. Canterbury Sep 19 Canterbury -13.50
4 Hawke’s Bay vs. Bay of Plenty Sep 20 Hawke’s Bay 10.20
5 Auckland vs. North Harbour Sep 20 Auckland 18.50
6 Manawatu vs. Southland Sep 20 Southland -0.20
7 Otago vs. Waikato Sep 21 Otago 1.60
8 Wellington vs. Tasman Sep 21 Wellington 0.10


September 15, 2014

Briefly

  • From the Brainflapping blog at the Guardian, a set of classifications for science stories (Axe Grinding, Soapbox, Wild Extrapolation). My favourite “Article has not been checked by anyone who knows how to communicate”

Stat of the Week Competition: September 13 – 19 2014

Each week, we would like to invite readers of Stats Chat to submit nominations for our Stat of the Week competition and be in with the chance to win an iTunes voucher.

Here’s how it works:

  • Anyone may add a comment on this post to nominate their Stat of the Week candidate before midday Friday September 19 2014.
  • Statistics can be bad, exemplary or fascinating.
  • The statistic must be in the NZ media during the period of September 13 – 19 2014 inclusive.
  • Quote the statistic, when and where it was published and tell us why it should be our Stat of the Week.

Next Monday at midday we’ll announce the winner of this week’s Stat of the Week competition, and start a new one.

(more…)

Stat of the Week Competition Discussion: September 13 – 19 2014

If you’d like to comment on or debate any of this week’s Stat of the Week nominations, please do so below!

September 10, 2014

Cannabis graduation exaggeration

3News

Teenagers who use cannabis daily are seven times more likely to attempt suicide and 60 percent less likely to complete high school than those who don’t, latest research shows.

Me (via Science Media Center)

“The associations in the paper are summarised by estimated odds ratios comparing non-users to those who used cannabis daily. This can easily be misleading to non-specialists in two ways. Firstly, nearly all the statistical evidence comes from the roughly 1000 participants who used cannabis less than daily, not the roughly 50 daily users — the estimates for daily users are an extrapolation.

“Secondly, odds ratios are hard to interpret.  For example, the odds ratio of 0.37 for high-school graduation could easily be misinterpreted as a 0.37 times lower rate of graduation in very heavy cannabis users. In fact, if the overall graduation rate matched the New Zealand rate of 75%, the rate in very heavy cannabis users would be 53%, and the rate in those who used cannabis more than monthly but less than weekly would be 65%.

That is, the estimated rate of completing high school is not 60% lower, it’s about 20% lower.  This is before you worry  about the extrapolation from moderate to heavy users and the causality question. The 60% figure is unambiguously wrong. It isn’t even what the paper claims.  It’s an easy mistake to make, though the researchers should have done more to prevent it, and that’s why it was part of my comments last week.

You can read all the Science Media Centre commentary here.


[Update: The erroneous ‘60% less likely to complete high school’ statement is in the journal press release. That’s unprofessional at best.]

(I could also be picky and point out 3News have the journal wrong: The Lancet Psychiatry, which started this year, is not the same as The Lancet, founded in 1823)