September 24, 2014
NRL Predictions for the Preliminary Finals
Team Ratings for the Preliminary Finals
The basic method is described on my Department home page. I have made some changes to the methodology this year, including shrinking the ratings between seasons.
Here are the team ratings prior to this week’s games, along with the ratings at the start of the season.
| Current Rating | Rating at Season Start | Difference | |
|---|---|---|---|
| Rabbitohs | 11.42 | 5.82 | 5.60 |
| Roosters | 9.66 | 12.35 | -2.70 |
| Cowboys | 9.46 | 6.01 | 3.40 |
| Storm | 4.47 | 7.64 | -3.20 |
| Panthers | 4.45 | -2.48 | 6.90 |
| Broncos | 3.86 | -4.69 | 8.50 |
| Warriors | 2.82 | -0.72 | 3.50 |
| Sea Eagles | 2.78 | 9.10 | -6.30 |
| Bulldogs | 0.42 | 2.46 | -2.00 |
| Knights | -0.28 | 5.23 | -5.50 |
| Dragons | -2.10 | -7.57 | 5.50 |
| Raiders | -7.64 | -8.99 | 1.40 |
| Eels | -8.12 | -18.45 | 10.30 |
| Titans | -8.40 | 1.45 | -9.90 |
| Sharks | -10.92 | 2.32 | -13.20 |
| Wests Tigers | -13.68 | -11.26 | -2.40 |
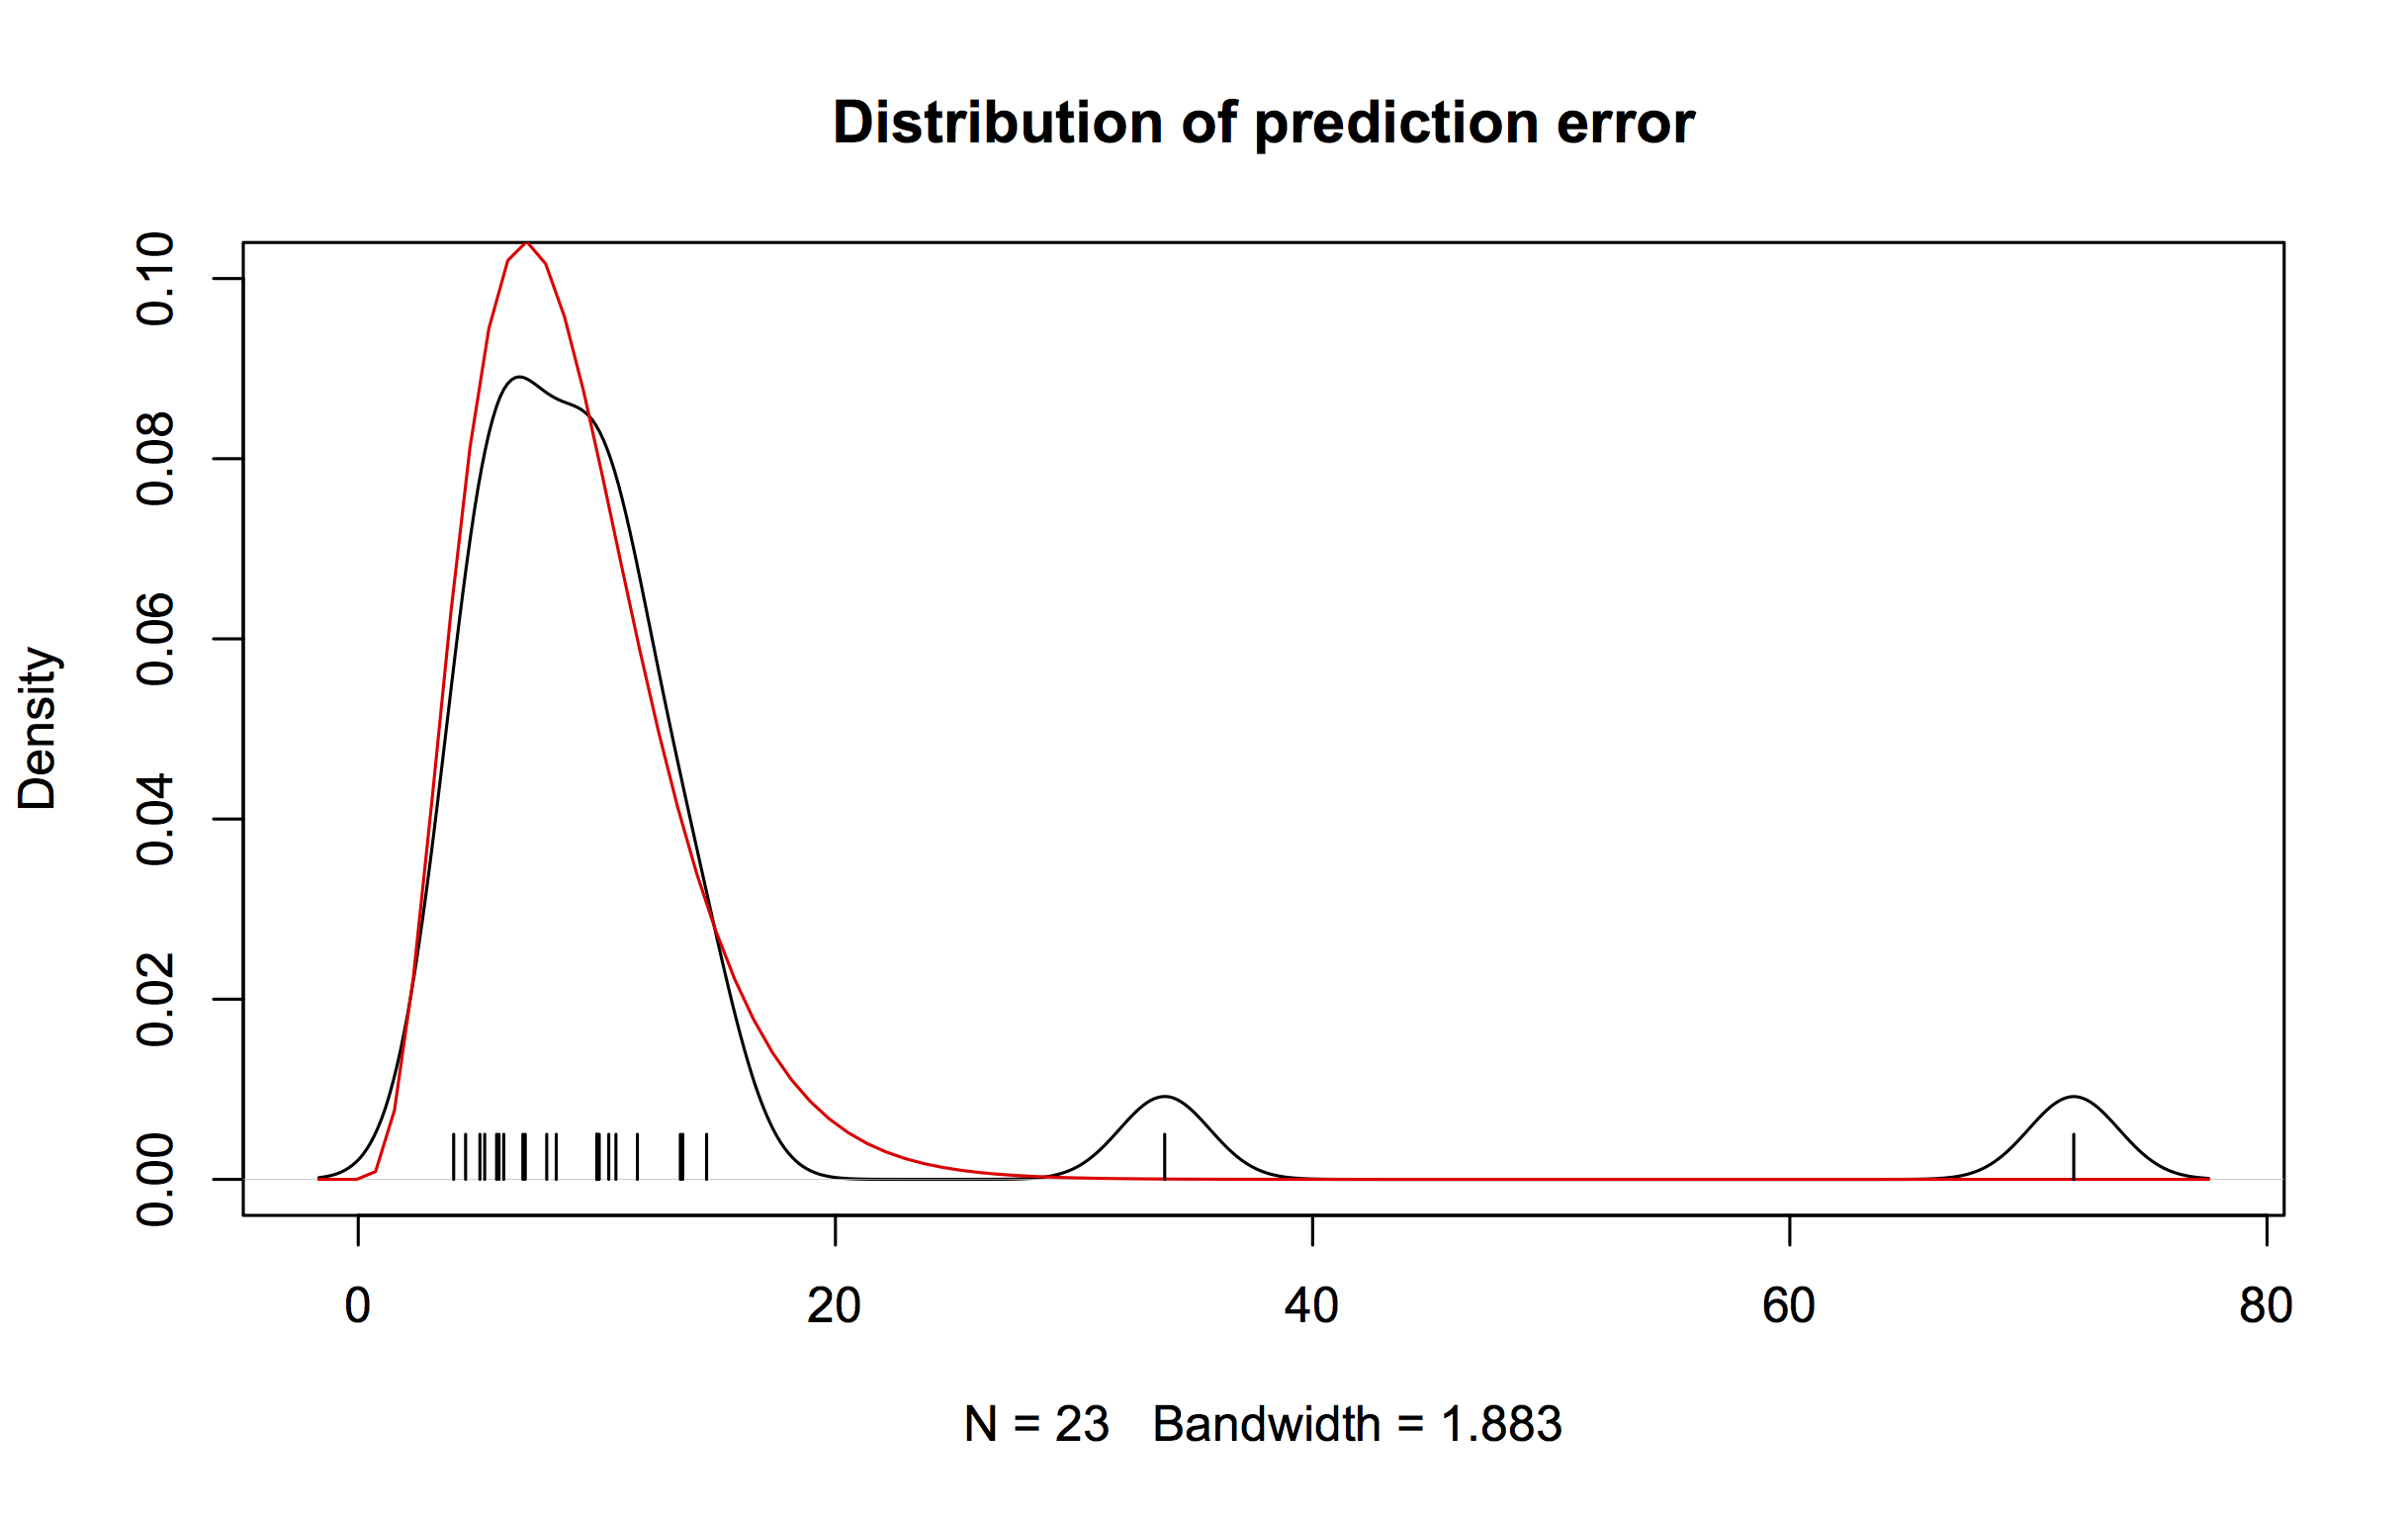
Performance So Far
So far there have been 198 matches played, 116 of which were correctly predicted, a success rate of 58.6%.
Here are the predictions for last week’s games.
| Game | Date | Score | Prediction | Correct | |
|---|---|---|---|---|---|
| 1 | Roosters vs. Cowboys | Sep 19 | 31 – 30 | 5.70 | TRUE |
| 2 | Sea Eagles vs. Bulldogs | Sep 20 | 17 – 18 | 3.20 | FALSE |
Predictions for the Preliminary Finals
Here are the predictions for the Preliminary Finals. The prediction is my estimated expected points difference with a positive margin being a win to the home team, and a negative margin a win to the away team.
| Game | Date | Winner | Prediction | |
|---|---|---|---|---|
| 1 | Rabbitohs vs. Roosters | Sep 26 | Rabbitohs | 6.30 |
| 2 | Panthers vs. Bulldogs | Sep 27 | Panthers | 4.00 |