Posts from May 2015 (43)

May 31, 2015

Of droughts and flooding rains

Australia’s climate is weird, even in the relatively habitable bits such as Melbourne, so it makes for interesting graphs. This is going to be another post about aspect ratios and alignment in graphs and how to use them for things other than lying with statistics. (more…)

May 30, 2015

Briefly

  • Michael LaCour, the researcher accused of faking data in his study on changing opinions about same-sex marriage, has issued a response to the allegations today as he promised. Virginia Hughes at Buzzfeed and  Ivan Oransky at RetractionWatch have stories. I’ve seen a lot of comments about this on Twitter from people who work in empirical social sciences or in ethics. So far I haven’t seen anyone who is convinced by the response.
  • There’s story in New York magazine about David Broockman, who found the problems, about the difficulty of reporting suspicions of fraud in research.  ““I think there’s an interesting metaphor between what I went through now and what I went through as a gay teenager,” Broockman says.
  • The UK is introducing a ‘legal highs’ ban. The government are using a widelyquoted figure of 97 deaths in the last year due to legal highs.  As Vice.com explains, the figure is bogus in two ways. Firstly, the figure is based on detectable presence of a drug, not on it being even a contributing cause. Secondly and more importantly, the drugs in the majority of these cases were already illegal at the time.
  • You’ve probably seen the Washington Post chart of deaths in World Cup construction. Unless you saw it at the original site, you may not have seen the disclaimer above it (emphasis added):

Some of these numbers (like Sochi’s) are third-party estimates, others (like Beijing’s) are based on official numbers that are almost certainly an undercount. And it’s tough to do an apples-to-apples comparison here, since the Qatar estimates include the deaths of all migrant workers after the announcement of Qatar’s successful bid in 2010, while other countries’ figures may only include deaths directly related to, say, stadium construction.

The exploitation of migrant workers isn’t new and it isn’t all Sepp Blatter’s fault. It’s one of the reasons Qatar was regarded as a terrible choice at the time.
Social media tends to spread images out of context, and this can be a problem if you’re trying to be seen as the sort of journalist who cares about facts.

Coffee health limit exaggerated

The Herald says

Drinking the caffeine equivalent of more than four espressos a day is harmful to health, especially for minors and pregnant women, the European Union food safety agency has said.

“It is the first time that the risks from caffeine from all dietary sources have been assessed at EU level,” the EFSA said, recommending that an adult’s daily caffeine intake remain below 400mg a day.

Deciding a recommended limit was a request of the European Commission, the EU’s executive body, to try to find a Europe-wide benchmark for caffeine consumption.

But regulators said the most worrying aspect was not the espressos and lattes consumed on cafe terraces across Europe, but Red Bull-style energy drinks, hugely popular with the young.

Contrast that with the Scientific Opinion on the safety of caffeine from the EFSA Panel on Dietetic Products, Nutrition, and Allergies (PDF of the whole thing). First, what they were asked for

the EFSA Panel … was asked to deliver a scientific opinion on the safety of caffeine. Advice should be provided on a daily intake of caffeine, from all sources, that does not give rise to concerns about harmful effects to health for the general population and for specific subgroups of the population. Possible interactions between caffeine and other constituents of so-called “energy drinks”, alcohol, synephrine and physical exercise should also be addressed.

and what they concluded (there’s more than 100 pages extra detail if you want it)

Single doses of caffeine up to 200 mg, corresponding to about 3 mg/kg bw for a 70-kg adult are unlikely to induce clinically relevant changes in blood pressure, myocardial blood flow, hydration status or body temperature, to  reduce perceived extertion/effort during exercise or to mask the subjective perception of alcohol intoxication. Daily caffeine intakes from all sources up to 400 mg per day do not raise safety concerns for adults in the general population, except pregnant women. Other common constituents of “energy drinks” (i.e. taurine, D-glucurono-γ- lactone) or alcohol are unlikely to adversely interact with caffeine. The short- and long-term effects of co-consumption of caffeine and synephrine on the cardiovascular system have not been adequately investigated in humans. Daily caffeine intakes from all sources up to 200 mg per day by pregnant women do not raise safety concerns for the fetus. For children and adolescents, the information available is insufficient to base a safe level of caffeine intake. The Panel considers that caffeine intakes of no concern derived for acute consumption in adults (3 mg/kg bw per day) may serve as a basis to derive daily caffeine intakes of no concern for children and adolescents.

Or, in even shorter paraphrase.

<shrugs> If you need a safe level, four cups a day seems pretty harmless in healthy people, and there doesn’t seem to be a special reason to worry about teenagers.


May 28, 2015

NRL Predictions for Round 12

Team Ratings for Round 12

The basic method is described on my Department home page.

Here are the team ratings prior to this week’s games, along with the ratings at the start of the season.

Current Rating Rating at Season Start Difference
Roosters 9.18 9.09 0.10
Cowboys 7.12 9.52 -2.40
Storm 5.13 4.36 0.80
Rabbitohs 5.07 13.06 -8.00
Broncos 4.56 4.03 0.50
Dragons 2.04 -1.74 3.80
Panthers 1.01 3.69 -2.70
Warriors 0.85 3.07 -2.20
Bulldogs -1.41 0.21 -1.60
Sea Eagles -2.10 2.68 -4.80
Knights -2.42 -0.28 -2.10
Raiders -2.55 -7.09 4.50
Sharks -5.61 -10.76 5.10
Eels -5.90 -7.19 1.30
Wests Tigers -6.65 -13.13 6.50
Titans -6.97 -8.20 1.20


Performance So Far

So far there have been 84 matches played, 47 of which were correctly predicted, a success rate of 56%.

Here are the predictions for last week’s games.

Game Date Score Prediction Correct
1 Rabbitohs vs. Eels May 22 14 – 12 15.90 TRUE
2 Wests Tigers vs. Cowboys May 23 0 – 8 -11.30 TRUE
3 Raiders vs. Bulldogs May 24 34 – 41 3.30 FALSE
4 Knights vs. Broncos May 25 18 – 31 -2.50 TRUE


Predictions for Round 12

Here are the predictions for Round 12. The prediction is my estimated expected points difference with a positive margin being a win to the home team, and a negative margin a win to the away team.

Game Date Winner Prediction
1 Panthers vs. Eels May 29 Panthers 9.90
2 Cowboys vs. Sea Eagles May 30 Cowboys 12.20
3 Raiders vs. Broncos May 30 Broncos -4.10
4 Titans vs. Rabbitohs May 30 Rabbitohs -9.00
5 Dragons vs. Sharks May 31 Dragons 10.70
6 Warriors vs. Knights May 31 Warriors 7.30
7 Roosters vs. Storm Jun 01 Roosters 7.00


Super 15 Predictions for Round 16

Team Ratings for Round 16

The basic method is described on my Department home page.

Here are the team ratings prior to this week’s games, along with the ratings at the start of the season.

Current Rating Rating at Season Start Difference
Crusaders 8.35 10.42 -2.10
Hurricanes 6.78 2.89 3.90
Waratahs 6.74 10.00 -3.30
Chiefs 4.95 2.23 2.70
Brumbies 4.16 2.20 2.00
Highlanders 3.77 -2.54 6.30
Stormers 2.68 1.68 1.00
Bulls 2.22 2.88 -0.70
Sharks -1.59 3.91 -5.50
Blues -1.68 1.44 -3.10
Lions -1.69 -3.39 1.70
Rebels -4.92 -9.53 4.60
Force -5.80 -4.67 -1.10
Cheetahs -8.00 -5.55 -2.50
Reds -8.95 -4.98 -4.00


Performance So Far

So far there have been 99 matches played, 66 of which were correctly predicted, a success rate of 66.7%.

Here are the predictions for last week’s games.

Game Date Score Prediction Correct
1 Chiefs vs. Bulls May 22 34 – 20 6.20 TRUE
2 Reds vs. Sharks May 22 14 – 21 -2.20 TRUE
3 Blues vs. Hurricanes May 23 5 – 29 -2.00 TRUE
4 Waratahs vs. Crusaders May 23 32 – 22 1.80 TRUE
5 Force vs. Highlanders May 23 3 – 23 -3.10 TRUE
6 Cheetahs vs. Lions May 23 17 – 40 0.30 FALSE
7 Stormers vs. Rebels May 23 31 – 15 11.40 TRUE


Predictions for Round 16

Here are the predictions for Round 16. The prediction is my estimated expected points difference with a positive margin being a win to the home team, and a negative margin a win to the away team.

Game Date Winner Prediction
1 Crusaders vs. Hurricanes May 29 Crusaders 5.60
2 Brumbies vs. Bulls May 29 Brumbies 6.40
3 Sharks vs. Rebels May 29 Sharks 7.80
4 Highlanders vs. Chiefs May 30 Highlanders 2.80
5 Force vs. Reds May 30 Force 7.20
6 Stormers vs. Cheetahs May 30 Stormers 14.70
7 Lions vs. Waratahs May 30 Waratahs -3.90


Junk food science

In an interesting sting on the world of science journalism, John Bohannon and two colleagues, plus a German medical doctor, ran a small randomised experiment on the effects of chocolate consumption, and found better weight loss in those given chocolate. The experiment was real and the measurements were real, but the medical journal  was the sort that published their paper two weeks after submission, with no changes.

Here’s a dirty little science secret: If you measure a large number of things about a small number of people, you are almost guaranteed to get a “statistically significant” result. Our study included 18 different measurements—weight, cholesterol, sodium, blood protein levels, sleep quality, well-being, etc.—from 15 people. (One subject was dropped.) That study design is a recipe for false positives.

Think of the measurements as lottery tickets. Each one has a small chance of paying off in the form of a “significant” result that we can spin a story around and sell to the media. The more tickets you buy, the more likely you are to win. We didn’t know exactly what would pan out—the headline could have been that chocolate improves sleep or lowers blood pressure—but we knew our chances of getting at least one “statistically significant” result were pretty good.

Bohannon and his conspirators were doing this deliberately, but lots of people do it accidentally. Their study was (deliberately) crappier than average, but since the journalists didn’t ask, that didn’t matter. You should go read the whole thing.

Finally, two answers for obvious concerns: first, the participants were told the research was for a documentary on dieting, not that it was in any sense real scientific research. Second: no, neither Stuff nor the Herald fell for it.

 [Update: Although there was participant consent, there wasn’t ethics committee review. An ethics committee probably wouldn’t have allowed it. Hilda Bastian on Twitter]

Road deaths up (maybe)

In Australia road deaths are going down but in New Zealand the number has shot up“, says the Herald, giving depressing-looking international comparisons from newly-announced OECD data. The percentage increase was highest in New Zealand The story does go on to point out that the increase reverses a decrease the previous year, suggesting that it might be that 2013 was especially good, and says

An ITF spokesman said New Zealand’s relatively small size made percentage movements more dramatic.”

Overall, it’s a good piece. Two things I want to add: first, it’s almost always useful to see more context in a time series if it’s available. I took the International Road Traffic Accident Database and picked out a group of countries with similar road toll to New Zealand in 2000: all those between 200 and 1000. The list is Austria, Denmark, Finland, Ireland, Israel, New Zealand, Norway, Slovenia, Sweden, Switzerland. Here are the data for 2000 and for 2010-2014; New Zealand is in red.

roaddeaths

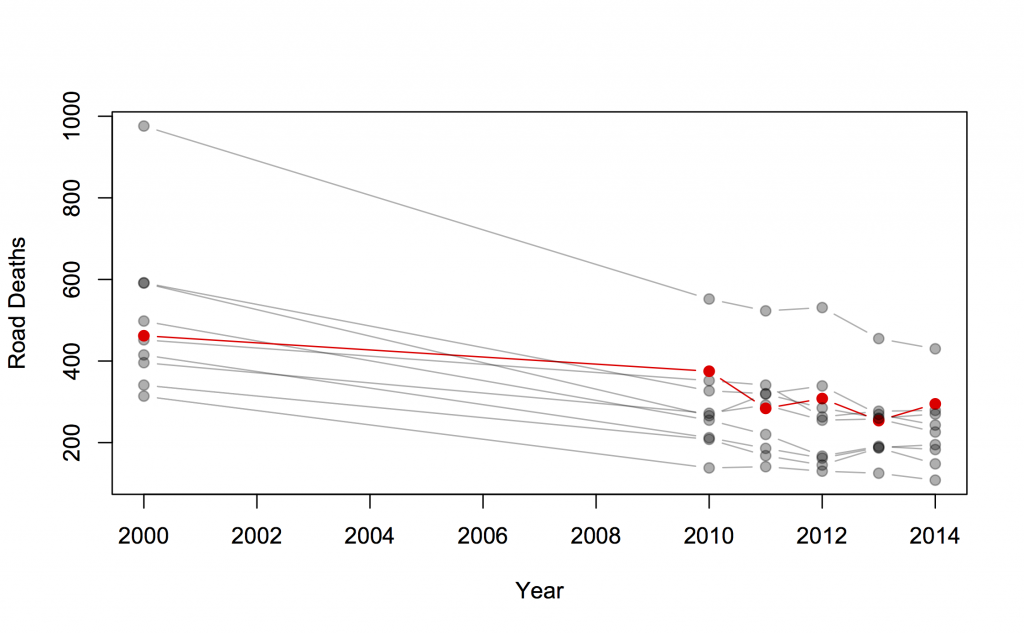
There’s a general downward trend, but quite a bit of bouncing around due to random variation. As we keep pointing out, there are lots of mistakes made when driving, and it takes bad luck to make one of these fatal, so there is a lot of chance involved. It’s clear from the graph that the increase is not much larger than random variation.

Calculations using the Poisson distribution (the simplest reasonable mathematical model, and the one with the smallest random variation) are, likewise, borderline. There’s only weak evidence that road risk was higher last year than in 2013. The right reference level, though, isn’t ‘no change’, it’s the sort of decrease that other countries are seeing.  The median change in this group of 10 countries was a 5% decrease, and there’s pretty good evidence that New Zealand’s risk did not decrease 5%.  Also, the increase is still present this year, making it more convincing.

What we can’t really do is explain why. As the Herald story says, some of the international decrease is economic: driving costs money, so people do less of it in recessions. Since New Zealand was less badly hit by recession, you’d expect less decrease in driving here, and so less decrease in road deaths. Maybe.

One thing we do know: while it’s tempting and would be poetic justice, it’s not valid to use the increase as evidence that recent road-safety rule changes have been ineffective. That would be just as dishonest as the claims for visible success of the speed tolerance rules in the past.


May 27, 2015

We like to drive in convoys

This isn’t precisely statistics, more applied probability, but that still counts.  First, an interactive from Lewis Lehe, a PhD student in Transport Engineering at UC Berkeley. It shows why buses always clump together.

busclump

You might also like his simulations of bottlenecks/gridlock and of congestion waves in traffic (via @flowingdata)


And second, a video from the New York subway system. When a train gets delayed, it holds up all the trains behind it. More surprisingly, the system is set up to delay the train in front of it, to keep the maximum gap between trains smaller.

May 26, 2015

Who is my neighbour?

The Herald has a story with data from the General Social Survey. Respondents were asked if they would feel comfortable with a neighbour who was from a religious minority, LGBT, from an ethnic or racial minority, with mental illness, or a new migrant.  The point of the story was that the figure was about 50% for mental illness, compared to about 75% for the other groups. It’s a good story; you can go read it.

What I want to do here is look at how the 75% varies across the population, using the detailed tables that StatsNZ provides. Trends across time would have been most interesting, but this question is new, so we can’t get them. As a surrogate for time trends, I first looked at age groups, with these results [as usual, click to embiggen]

neighour-age

There’s remarkably little variation by age: just a slight downturn for LGBT acceptance in the oldest group. I had expected an initial increase then a decrease: a combination of a real age effect due to teenagers growing up, then a cohort effect where people born a long time ago have old-fashioned views. I’d also expected more difference between the four questions over age group.

After that, I wasn’t sure what to expect looking at the data by region. Again, there’s relatively little variation.

neighbour-region

For gender and education at least the expected relationships held: women and men were fairly similar except that men were less comfortable with LGBT neighbours, and comfort went up with education.

neighour-sexeduc

Dividing people up by ethnicity and migrant status was a mixture of expected and surprising. It’s not a surprise that migrants are happier with migrants as neighbours, or, since they are more likely to be members of religious minorities, that they are more comfortable with them. I was expecting migrants and people of Pacific or Asian ethnicity to be less comfortable with LGBT neighbours, and they were. I wasn’t expecting Pacific people to be the least comfortable with neighbours from an ethnic or racial minority.

neighbour-ethnic

As always with this sort of data it’s important to remember these responses aren’t really level of comfort with different types of neighbours. They aren’t even really what people think their level of comfort would be with different types of neighbours, just whether they say they would be comfortable. The similarity across the four questions makes me suspect there’s a lot of social conformity bias creeping in.

May 25, 2015

Cancer vaccine?

The segment was about research from the Malaghan Institute, who are working on ways to encourage a patient’s immune system to attack tumours. They say, in a press release

While the research will focus specifically on targeting melanoma, it is anticipated that the methodology being developed could be applied to other cancers in the future.

The therapeutic vaccine approach differs from the preventative vaccines used to protect against diseases such as measles or the flu because the cancer vaccine is designed to be given to an individual after they have already shown signs of disease.

“It is known that white blood cells called T cells can kill tumour cells,” says Dr Hermans. “The cancer vaccines, which are custom-made for each cancer patient, are designed to stimulate the activity of these cancer-fighting immune cells.”

As the press release makes clear, the term ‘vaccine’ is technically correct, but liable to mislead: these are customised immune-system treatments specific to one tumour in one individual. It’s nothing like the measles vaccine that you get as an infant for lifetime protection.

Like other research groups, the Malaghan Institute are starting with melanoma. There are at least two reasons melanoma is a good place to start. The simple reason: until very recently, metastatic melanoma was completely untreatable, so anything would be an improvement. There’s also a complex reason: melanoma occasionally shrinks or vanishes of its own accord, apparently more often than other tumours do. The spontaneous regressions are presumably thanks to the immune system waking up and realising the tumour is a problem, so melanoma is a good starting point if you want to find out how this happens and encourage it to happen more often.

The basic problem is that the immune system tends to see cancer cells as part of the patient, since, fundamentally, they are. The Malaghan Institute has a innovative addition to the treatment, a chemical that scares specific parts of the immune system into action. They expect that combining this with the existing tumour vaccine approaches will give a more reliable result.

Malaghan got $4.5 million from the Health Research Council to work on this, which is pretty impressive given the HRC budget and competition, but the melanoma vaccine is still in the initial stages of testing. The majority of promising treatments going in to Phase I clinical trials don’t end up being useful. Even if this one does, that’s no guarantee it will work for other types of cancer, and while it’s a vaccine in the sense that it works by stimulating an immune reaction, it’s nothing like the vaccines we give to kids.

It’s not a good time to criticise Campbell Live, but although the Malaghan’s research is truly impressive, it’s not a general-purpose cure for cancer anytime this decade. And there’s a basic principle that you shouldn’t say “cure” in the headline unless there’s a cure.