Posts from June 2015 (39)

June 29, 2015

Stat of the Week Competition: June 27 – July 3 2015

Each week, we would like to invite readers of Stats Chat to submit nominations for our Stat of the Week competition and be in with the chance to win an iTunes voucher.

Here’s how it works:

  • Anyone may add a comment on this post to nominate their Stat of the Week candidate before midday Friday July 3 2015.
  • Statistics can be bad, exemplary or fascinating.
  • The statistic must be in the NZ media during the period of June 27 – July 3 2015 inclusive.
  • Quote the statistic, when and where it was published and tell us why it should be our Stat of the Week.

Next Monday at midday we’ll announce the winner of this week’s Stat of the Week competition, and start a new one.

(more…)

Stat of the Week Competition Discussion: June 27 – July 3 2015

If you’d like to comment on or debate any of this week’s Stat of the Week nominations, please do so below!

June 25, 2015

Poetry about statistics

On Twitter, Evelyn Lamb pointed me to the poem “A contribution to Statistics”, by Wisława Szymborska (who won the 1996 Nobel Prize for Literature). It begins

Out of every hundred people

those who always know better:
— fifty-two,

doubting every step
   — nearly all the rest,

glad to lend a hand
if it doesn’t take too long:
— as high as forty-nine,

Read all of it here

The same blog, “Poetry with Mathematics”, has some other statistically themed poems:

The last was written in honour of Florence Nightingale, who was the first female member of the Royal Statistical Society, and also an honorary member of the American Statistical Association.

June 24, 2015

NRL Predictions for Round 16

Team Ratings for Round 16

The basic method is described on my Department home page.

Here are the team ratings prior to this week’s games, along with the ratings at the start of the season.

Current Rating Rating at Season Start Difference
Roosters 8.82 9.09 -0.30
Broncos 6.98 4.03 2.90
Cowboys 6.07 9.52 -3.50
Storm 4.02 4.36 -0.30
Rabbitohs 3.88 13.06 -9.20
Dragons 2.55 -1.74 4.30
Warriors 0.63 3.07 -2.40
Bulldogs -0.85 0.21 -1.10
Raiders -1.08 -7.09 6.00
Panthers -2.05 3.69 -5.70
Sea Eagles -2.78 2.68 -5.50
Eels -3.44 -7.19 3.70
Knights -4.44 -0.28 -4.20
Wests Tigers -5.18 -13.13 7.90
Sharks -5.42 -10.76 5.30
Titans -6.37 -8.20 1.80


Performance So Far

So far there have been 110 matches played, 62 of which were correctly predicted, a success rate of 56.4%.

Here are the predictions for last week’s games.

Game Date Score Prediction Correct
1 Sea Eagles vs. Wests Tigers Jun 19 30 – 20 4.60 TRUE
2 Bulldogs vs. Panthers Jun 20 24 – 12 2.90 TRUE
3 Raiders vs. Cowboys Jun 20 20 – 21 -4.70 TRUE
4 Titans vs. Warriors Jun 20 14 – 36 0.00 FALSE
5 Knights vs. Sharks Jun 21 28 – 30 5.00 FALSE
6 Storm vs. Broncos Jun 21 12 – 14 0.40 FALSE
7 Dragons vs. Roosters Jun 22 14 – 19 -3.00 TRUE


Predictions for Round 16

Here are the predictions for Round 16. The prediction is my estimated expected points difference with a positive margin being a win to the home team, and a negative margin a win to the away team.

Game Date Winner Prediction
1 Broncos vs. Knights Jun 26 Broncos 14.40
2 Rabbitohs vs. Sea Eagles Jun 26 Rabbitohs 9.70
3 Cowboys vs. Sharks Jun 27 Cowboys 14.50
4 Eels vs. Dragons Jun 27 Dragons -3.00
5 Warriors vs. Raiders Jun 27 Warriors 5.70
6 Roosters vs. Titans Jun 28 Roosters 18.20
7 Wests Tigers vs. Panthers Jun 28 Panthers -0.10
8 Bulldogs vs. Storm Jun 29 Storm -1.90


Super 15 Predictions for the Qualifying Finals

Team Ratings for the Qualifying Finals: Correction

I made a mistake in entering the fixtures and had the Waratahs playing away.

The basic method is described on my Department home page.

Here are the team ratings prior to this week’s games, along with the ratings at the start of the season.

Current Rating Rating at Season Start Difference
Crusaders 10.77 10.42 0.40
Hurricanes 8.31 2.89 5.40
Waratahs 7.48 10.00 -2.50
Highlanders 5.62 -2.54 8.20
Brumbies 5.03 2.20 2.80
Chiefs 3.58 2.23 1.40
Stormers 0.47 1.68 -1.20
Bulls 0.39 2.88 -2.50
Lions -0.55 -3.39 2.80
Sharks -0.65 3.91 -4.60
Blues -4.49 1.44 -5.90
Rebels -4.89 -9.53 4.60
Force -7.16 -4.67 -2.50
Cheetahs -8.22 -5.55 -2.70
Reds -8.70 -4.98 -3.70


Performance So Far

So far there have been 122 matches played, 80 of which were correctly predicted, a success rate of 65.6%.

Here are the predictions for last week’s games.

Game Date Score Prediction Correct
1 Highlanders vs. Chiefs Jun 20 24 – 14 5.40 TRUE
2 Stormers vs. Brumbies Jun 20 19 – 39 2.50 FALSE


Predictions for the Qualifying Finals

Here are the predictions for the Qualifying Finals. The prediction is my estimated expected points difference with a positive margin being a win to the home team, and a negative margin a win to the away team.

Game Date Winner Prediction
1 Hurricanes vs. Brumbies Jun 27 Hurricanes 7.80
2 Waratahs vs. Highlanders Jun 27 Waratahs 6.40


June 23, 2015

Refugee numbers

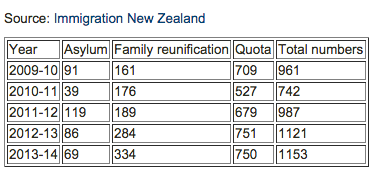
Brent Edwards on Radio NZ’s Checkpoint has done a good job of fact-checking claims about refugee numbers in New Zealand.  Amnesty NZ tweeted this summary table

CIJSRW9UMAABRkB

If you want the original sources for the numbers, the Immigration Department Refugee Statistics page is here (and Google finds it easily).

The ‘Asylum’ numbers are in the Refugee and Protection Status Statistics Pack, the “Approved” column of the first table. The ‘Family reunification’ numbers are in the Refugee Family Support Category Statistics Pack in the ‘Residence Visas Granted’ section of the first table. The ‘Quota’ numbers are in the Refugee Quota Settlement Statistics Pack, in the right-hand margin of the first table.

Update: @DoingOurBitNZ pointed me to the appeals process, which admits about 50 more refugees per year: 53 in 2013/4; 57 in 2012/3; 63 in 2011/2; 27 in 2010/11.


June 22, 2015

Stat of the Week Competition: June 20 – 26 2015

Each week, we would like to invite readers of Stats Chat to submit nominations for our Stat of the Week competition and be in with the chance to win an iTunes voucher.

Here’s how it works:

  • Anyone may add a comment on this post to nominate their Stat of the Week candidate before midday Friday June 26 2015.
  • Statistics can be bad, exemplary or fascinating.
  • The statistic must be in the NZ media during the period of June 20 – 26 2015 inclusive.
  • Quote the statistic, when and where it was published and tell us why it should be our Stat of the Week.

Next Monday at midday we’ll announce the winner of this week’s Stat of the Week competition, and start a new one.

(more…)

Stat of the Week Competition Discussion: June 20 – 26 2015

If you’d like to comment on or debate any of this week’s Stat of the Week nominations, please do so below!

June 21, 2015

Sunbathing and babies

The Herald (from the Daily Mail)

A sunshine break is the perfect way to unwind, catch up on your reading and top up that tan.

But it seems a week soaking up the rays could also offer a surprising benefit – helping a woman have a baby.

Increased exposure to sunshine could raise the odds of becoming a mother by more than a third, a study suggests.


If you read StatsChat regularly, you probably won’t be surprised to hear the study had nothing to do with either holidays or sunbathing, or fertility in the usual sense.

As the story goes on to say, it was about the weather and IVF success rates. The researchers looked for correlations between a variety of weather measurements and a variety of ways of measuring IVF success. They didn’t find evidence of correlations with the weather at the time of conception. As they said (conference abstract, since this isn’t published)

When looking for a linear correlation between IVF results and the mean monthly values for the weather, the results were inconsistent.

So, following the ‘try, try again’ strategy they looked at weather a month earlier

However, when the same analysis was repeated with the weather results of 1 month earlier, there was a clear trend towards better IVF outcome with higher temperature, less rain and more sunshine hours. 

It helps, here, to know that “a clear trend” is jargon for “unimpresssive statistical evidence, but at least in the direction we wanted”.  That’s not the only problem, though. Since these are honest researchers, you find the other big problem in the section of the abstract labelled “limitations”

Because of the retrospective design of the study, further adjusting for possible confounding factors such as age of the woman, type of infertility and indication for IVF is mandatory. 

That is, their analysis lumped together women of different ages,  types of infertility, and reasons for using IVF, even those these have a much bigger impact on success than is being claimed for the weather.

I don’t have any problem with these analyses being performed and presented to other consenting scientists who are trying to work out ways to improve IVF.  On the other hand,  I’m pretty sure the Daily Mail didn’t get these results by reading the abstract book or sitting through the conference. Someone made a deliberate decision to get publicity for this research, at this stage, in a form where all the cautionary notes would be lost. 
 

Briefly

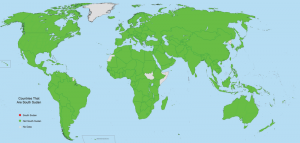
  • From Vox, for map nerds: “Countries that are South Sudan” in red, “Countries that are not South Sudan” in green, “No data” in grey
    countries_that_are_south_sudan.0
  • Medical marijuana laws didn’t lead to an increase in teenage marijuana use in the US (MinnPost, Lancet Psychiatry). This is less unsurprising than it sounds, because in some of the states, (eg, California) the medical-use requirement is not all that stringent.
  • Survey research finds that people who (claim to) have more sex are (or claim to be) happier. As XKCD has pointed out, this is something you can’t easily do a double-blind randomised trial of.  But you could do a trial of encouraging people to have more sex. It didn’t make them happier. This is an issue more generally with lifestyle changes: just because a lifestyle difference would be good, it doesn’t necessarily mean that a doctor telling you to make the change will be good. (via Tim Harford)
  • Google Research was looking for ways of visualising what actually happens in different layers of a computational neural network. They used feedback of images and amplification of layers to get things like
    ibis
  • Nice story in the Herald about second languages in Auckland. (though also note the Herald search page finds 514 stories with the phrase “melting pot”)